


The planets have aligned leading to unprecedented market prices in all mainland States, that will add to growing cost of living pressures. Despite election promises of lower power prices, the immediate future is moving in the opposite direction.
Our monthly report is being prepared which will contain more insights, while our at-a-glance results presented here, show the month of April has delivered unprecedented outcomes with:
- record April spot price outcomes in all mainland States of the NEM while Tasmania had the second highest on record, only exceeded in 2016 when Basslink failed for 6-months
- forward prices for FY-22/23 jumped during April, and now VIC, SA and Tasmania all have joined NSW and QLD with prices exceeding $100/MWh. NSW and QLD are closer to $150/MWh continuing the great divide between north and south
- higher average baseload outages were evident during the outage season month, exceeding outage levels for this time of year over the last 2-years
- gas powered generators have re-priced their spot market offers, as have the black coal sector to be more aligned with the opportunity cost of selling LNG or thermal coal in global markets
- utility scale solar generation was less than April of last year, despite more PV panels on the ground, impacted by a higher level of cloud cover in the critical areas across the country
- spot prices have become very digital where if an unusual number of outages occur, or little sunshine or wind; spot prices jump and remain consistently high all day and night
The draft Default Market Offers and Victorian Default Offers are under pressure to be upwardly revised, and it has been noted the final determination is now planned after the Federal election. Such timing will delay public awareness of the train coming down the track.
Further details are outlined below and our Monthly Report, which is a subscription service, will have additional insights. Please enjoy our at-a-glance scan.
April Spot Prices
Using the drop-down list, you can observe the highest April spot prices for each Region since 2001. All Regions set a record except for Tasmania, which was the second highest on record.
Forward Prices
Forward prices for the next financial year are shown in the chart below as at the end of the month for the last 5-months. The upward trend is very clear, and the upward surge in market prices was most evident in Queensland, Tasmania and Victoria.
Having two States near $150/MWh and all other NEM States near $100/MWh for the next financial year is an unprecedented outcome.
Baseload Outages
Average baseload outages were higher in Aprr-22 in all coal baseload States of NSW, Queensland and Victoria than the same time over the last 2-years. The maximum outage level was higher in NSW, and equal to previous maximum in Queensland and Victoria.
The trend over the last 3-years show April average outage levels are generally increasing each year.
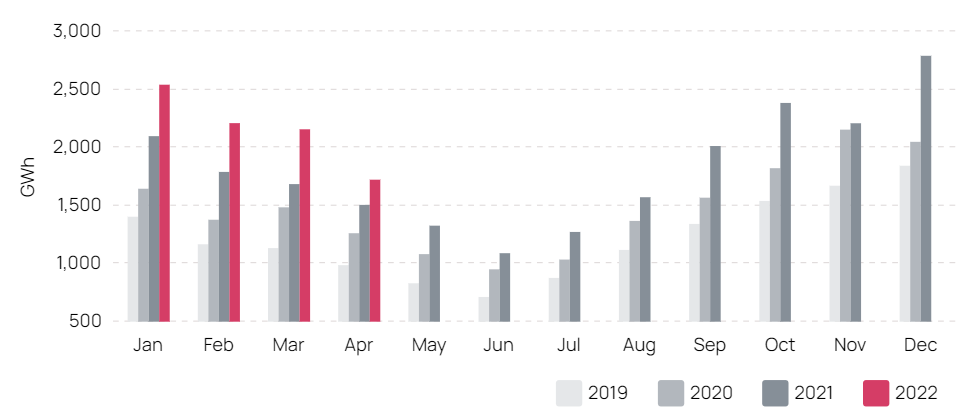
Solar Generation
The Utility-scale Solar generation sector had a increase in generation for Apr-22 compared to the same time last year, but the increase compared to the last 4-months of December to March was proportionally much lower.
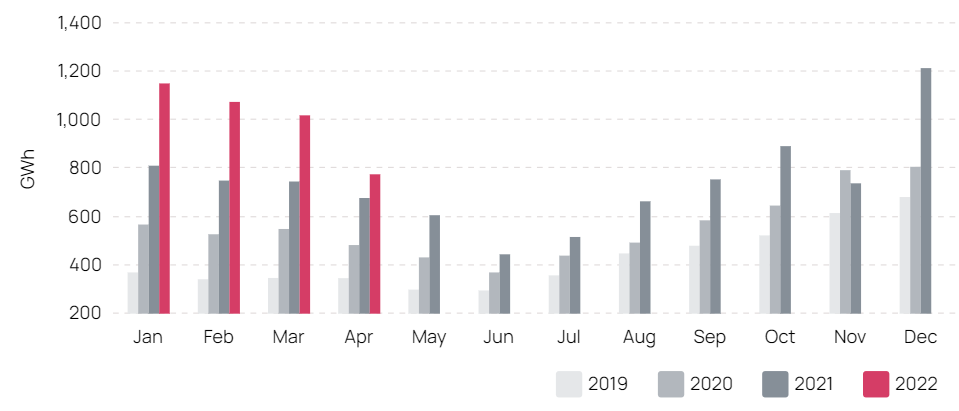
Roof-top solar PV was not as badly impacted as Utility-scale Solar and was lower than expected, but not to the same degree.
DMO and VDO
The commodity prices represent about a quarter to a third of bundled residential and small-medium size enterprises tariffs. The Default Market Offer (DMO) commodity cost is based on the trade weighted average price on ASX Energy since the relevant quarters were listed, while the Victorian Default Offer (VDO) only considers the last 12-months. The prices referenced are the base contracts and $300/MWh caps.
Looking at the base contracts for each State, the relevant trade weighted commodity prices in NSW and QLD are facing a 19% and almost 16% year-on-year increase, compared to the southern States of SA and Vic which are much closer to 5%.
These expected increases are higher than reported in our last monthly report caused by the upward surge in market prices and the heavy level of trading. Last month the increases reported were about 16.5% for NSW, 14.7% for QLD, -1% for SA and 4.6% for VIC.