


April spot prices rallied after a very soft summer quarter, and now May is tracking even stronger following the realisation of threatening extreme price events. During May there has been 3 occasions when extreme spot prices have threatened, and yesterday was the first time it was able to bite. We have a long way to go through winter, so hold on to your hats.
Setting the scene ...
So far this month, the days with threatening extreme evening peak prices have been:
- Wednesday 12 May
- Monday 17 May
- Tuesday 18 May
The pre-dispatch prices as at 8:00am each morning have been tracked against the actual spot price for each of these threatening days. On the first two occasions of Wednesday 12 May and Monday 17 May, the threat of extreme prices faded away; but on Tuesday 18 May the threat materialised.
What happened ...
The following charts show the evening peak for each of the 3 days for each State, the forecast spot price at 8:00am each day and the actual spot price. What is evident is that on the first two sample days, the pre-dispatch prices did not manifest, however on the third day extreme prices did bite but less than predicted.
Using the drop-down box on the chart, you can select the State that may interest you most. We have begun with VIC as it had the largest threat, followed by SA. By hovering over the area between the wave lines will open-up the chart. Tasmania has been excluded because the threat was not evident.
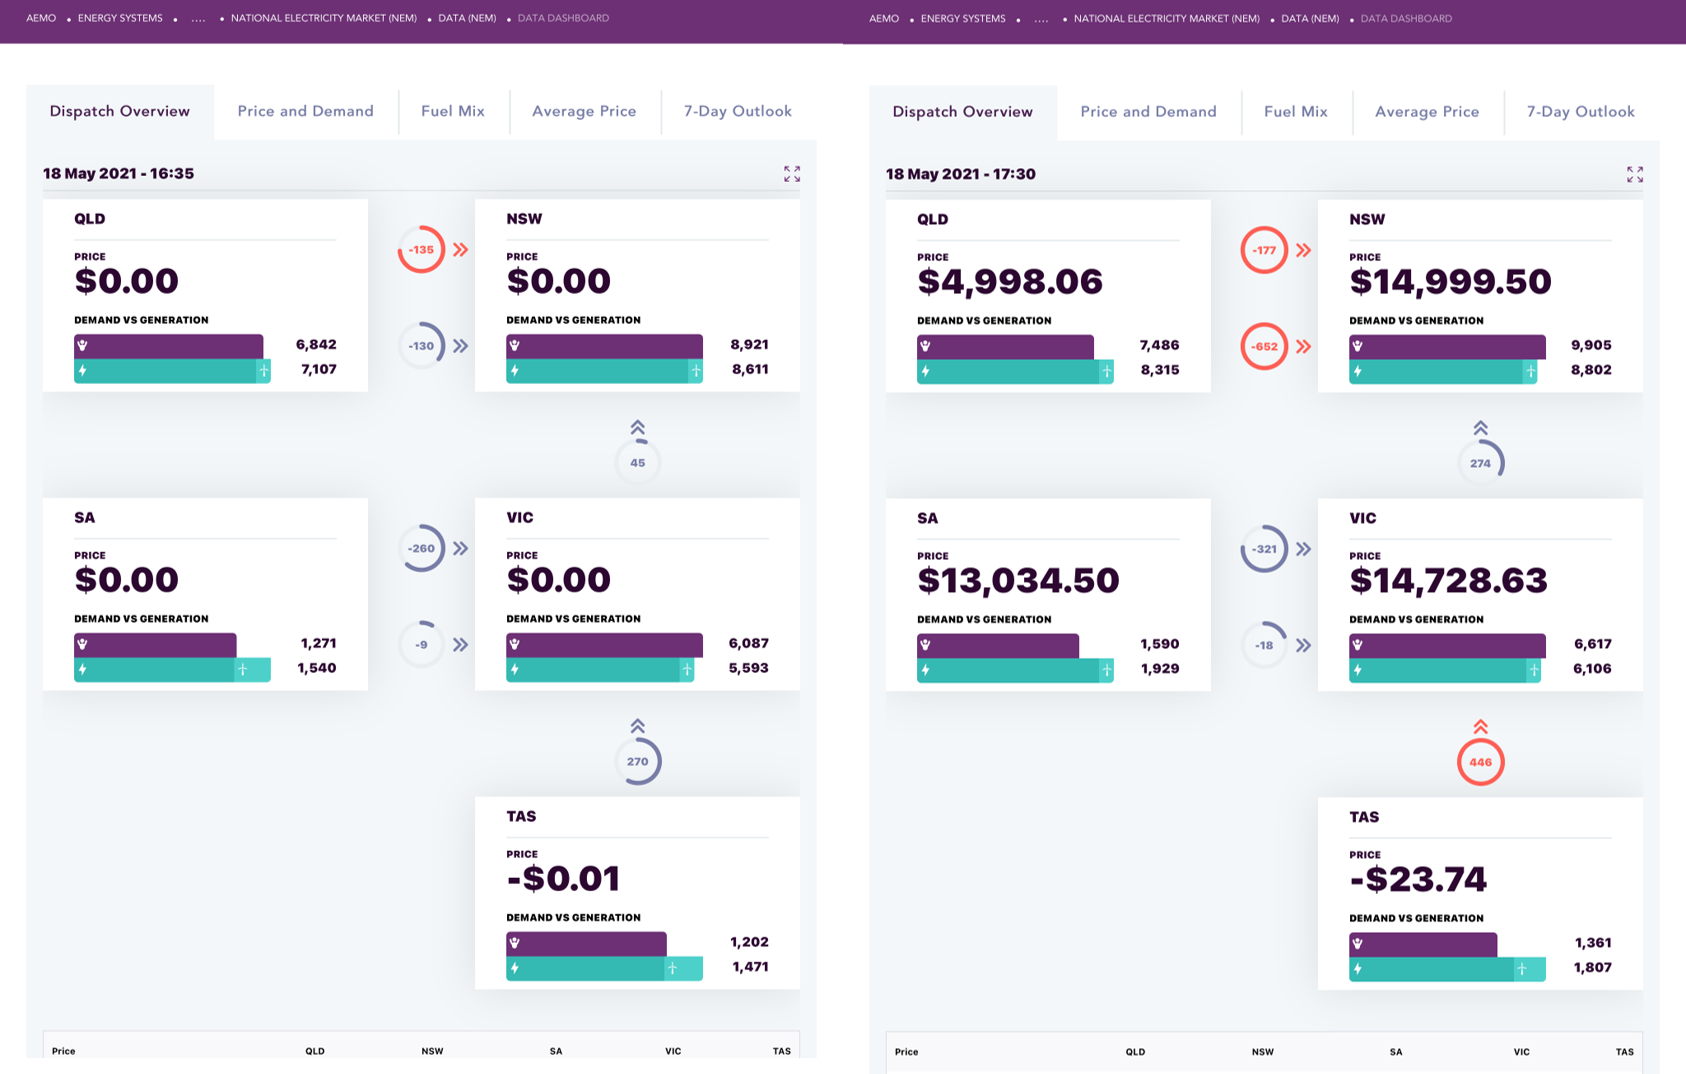
Last night (Tuesday 18 May), was the first case this month to bite and it was a volatile evening. Here are two screenshots of the AEMO dashboard, the first one showing spot prices at 16:35 when zero prices existed across the mainland States and negative 1 cent in Tasmania; and then 55 minutes later at 17:30 when prices were nudging $15,000/MWh in NSW, Vic and SA.
The cause of the threatening extreme prices was due to:
- low levels of wind generation
- dark hours thereby eliminating any contribution from solar which is an ongoing and growing winter dynamic
- cold weather, driving up demand
- more NSW and VIC baseload outages in May-21 compared to May-20
Impact of events ...
Using the chart below demonstrates that the month-to-date May spot price for 2021 is currently amongst the historical highest May averages for VIC, NSW and SA, recovering strongly from the soft Q1-21 when prices averaged $25, $38 and $41/MWh respectively. The undercurrent of key players wishing to elevate prices is beginning to manifest itself, and winter has a way to go.
If there are no further extreme events for the month, then the monthly average will probably soften by month-end, but at the moment:
- NSW current average of $86.07/MWh is the second-highest on record
- VIC current average of $84.65/MWh is amongst the big 3-years of 2017 to 2019
- SA current average of $84.07/MWh is just below the big 3-years of 2017 to 2019
- QLD current average of $56.20/MWh is amongst the top 8 May averages in the last 21 years
- TAS current average of $$39.99/MWh reflects being excluded from the big action
Conclusion ...
This year we have had environmental certificate costs surge and now Q2-21 spot power prices will likely strengthen the forward prices driven by a shift in perception of the winter risk, when solar has retired on cold and calm evenings.
Further information will be available in our May Monthly Report, and if you wish to subscribe, then simply follow this link.