


Prices tumble causing records to tumble. Big battery plans are prevalent, while there are 'movers and shakers' trying to stimulate prices to rise. Low spot prices are causing even lower price outcomes for solar and wind farms in the southern States. Forward prices for the next 3-years, are the lowest seen for many years.
Once the article has fully loaded, you will see a navigation bar on the right (or possibly at the top on a mobile device), that will allow you to jump around if you wish. There is also a Feedback questionnaire at the very end, where we invite you to score the report. Irrespective of how much of the report you read, we welcome your rating please. Enjoy!
1.0 Overview
Below are the key highlights from this month's Market Report:
Market Events
- there is an avalanche of battery energy storage system (BESS) projects on the drawing boards and so we have provided an insightful and interactive map with a description of all projects
- given the early retirement of Yallourn, we have updated the retirement plan
- the biggest Market News item for the month relates to AGL which includes splitting the company, acquisitions, a software joint venture and a knock-back on the Crib Point import terminal
Spot Prices
- March average spot electricity prices were low for Vic and Tas; NSW and QLD stronger; while SA had an extreme price event causing the average monthly price to increase from about $35/MWh to $68.90/MWh
- the average quarterly price was the lowest for Tasmania for 10-years, lowest QLD and VIC average price for 9-years, lowest NSW and SA average price for 6-years
- the proportion of negative half-hour prices continues to be material for SA
- There are 'movers and shakers' trying to stimulate higher spot price outcomes evident from their offers
Forward Prices
- with the extreme price event in SA, the $300/MWh cap product would have paid out more than the premium, unlike all other States where the cost would have far weighed the benefit
- the traded forward price before the commencement of Q1-21 was at a significant premium to the actual spot prices, proving again that the forward price does not have a good track record to predict future spot prices
- SA holds the crown for the lowest FY-21/22 forward price, and NSW maintains the crown for the highest
- the forward price outlook for the next 3-years is setting new records
Generation
- Winton solar farm (85MW) began operations in VIC
- Brown coal generation has stepped up since January this year, while Black coal has been consistent since November last year but much lower than same time last year. Gas powered generation is operating at about half of 2019 levels, while solar and wind have markedly increased
- average wind farm price earned by NSW wind farms is similar to the time weighted average, but VIC and SA is discounted
- average solar farm price earned in VIC was extremely low for the quarter and SA was even lower. For now, NSW and QLD are more resistant
Everything else...
- compared to previous years, Snowy's water storages are higher, and HydroTas is about the same
- FCAS costs were the highest since November, but far less than the same time last year
- Natural gas spot prices have hovered around $5.50/GJ to $6.25/GJ for the month, despite rising Asian prices
- VEET certificate costs are rising strongly due to Melbourne lock-downs and changes to rules, while LGC forward prices softened during the month before beginning to rise
- the BoM weather outlook for the next 3-months is warmer than average and drier in Queensland
2.0 Key Features
Our Key Features this month are a look at the avalanche of Battery Energy Storage Systems proposed, and an update of the planned retirement of plant given the bringing forward of Yallourn's closure.
Back in November last year we wrote an article called Gas-powered generation continuing to be bumped! where we made the point that gas-powered generation was meant to be the transitional fuel from coal to renewables. However, renewables jumped the queue, relegating gas-powered generation. We also predicted that Battery Energy Storage Systems would likely follow suit, and this prediction seems to be playing out as evident by all of these potential projects shown below. We coined the 2020's, the Lithium Decade. We also wonder whether hydrogen will be next technology to queue jump gas-powered generation?
In AEMO's draft Integrated System Plan 2020, we were astounded that there was not one new battery energy storage system predicted in the Central Scenario. Today, there are 10,900MW of battery projects publicly announced that range from an aspirational bright idea through to fully operational. Each project varies in capacity and duration.
By pointing to a symbol on the map it will display the detail of the project, and you can filter them by capacity using the legend. You can also zoom in and out if the symbols are too congested. If we have missed any, please let us know.
We studied the deployment of the large batteries in SA when the extreme price event occurred on Friday 12 March. The purpose of the research was to extract key learnings and issues for the market. The article can be found at Big Batteries - big issues and in summary, the findings were:
Introduction
It was a hard day at the office on Friday 12 March when SA experienced extreme spot prices, but Big Batteries were not able to fully capitalise. However, Big Batteries stand to receive a big boost when wholesale settlement rules change and extreme days occur, causing a significant wealth transfer favouring fast start generation. We unpack what happened and what are the implications?
Key Findings
- managing battery energy storage systems is complex and is made more difficult because of uncertain future prices for energy and frequency control ancillary services (FCAS)
- the performance of the 3 battery assets varied considerably during this eventful day, ranging from extracting 44% to 7% of the theoretical maximum energy arbitrage profit; noting this finding is based on only using the battery energy capacity, and not the capacity offered for FCAS
- if 5-minute wholesale settlement was applicable, then the performance measured against the theoretical maximum energy arbitrage profit for each battery would have improved to 70% in the best case, through to 10% in the worst case
- based on this event, we wonder whether the current battery dispatch algorithms are designed to maximise the profit for 5-minute wholesale settlement, despite 30-minute settlement being the current procedure creating a missed opportunity. It might be subtle, but the solutions are different and lead to different profit outcomes. We also wonder whether the algorithms risk-adjust the deployment strategies?
- when 5-minute settlement becomes effective on 1 October 2021, if events like this one observed in SA are repeated, then we will experience a massive wealth transfer in favour of fast start plant. In this example, for the same daily average price, we determined that the battery players arbitrage profits would have trebled
- the market needs fast start plant like batteries to perform well, and by doing so will enable more risk management services to be offered and performed, as well as contribute to the management of the grid particularly when under stress
- if the battery energy storage systems cannot perform well, then the cries for more dispatchable plant, deep storage systems and big interconnectors will increase in frequency and volume. If these alternatives are pursued along side batteries, the cost to the industry will increase and be less efficient, impacting investor financial returns. Consumers will probably pay more through higher regulated costs and market prices will try to be elevated despite more competition.
- we hope this piece of analysis is helpful to improve the understanding and challenges facing the market
With the announcement that Yallourn Power Station closure will close earlier than 2032, we have updated the planned closure timetable.
3.0 Market News Update
Our Market News has been delivered via a separate article Mar-21 Energy Market News with the big news item being AGL's initiatives:
- splitting of the company;
- acquisition of Tilt Renewables, Epho and Solgen;
- joint venture with OVO Energy leading to exclusive access to the A-I enabled platform;
- construction of a 250MW battery at Torrens Island and application to build a 200MW battery at Loy Yang;
- and finally, the Victorian Government rejecting the Crib Point import terminal
It is probably the most significant month in AGL’s 180-year history.
Other news items have been classified into Renewables, Storage, Generation, Gas Market, Financial, Climate and Policy/Regulation.
4.0 Electricity Spot Prices
This section undertakes an extensive look at spot prices beginning with a summary through to assessing the predictability of events.
March 2021 electricity spot prices rebounded for all mainland regions, most strongly in South Australia because of an extreme price event occurring on 12 March. On this day, extreme prices began after the evening peak and continued until 1:00am the next day due to an outage on the Heywood interconnector, calm wind conditions, substation fire causing Barkers Inlet to trip, and no solar due to the time of day. We have prepared two separate articles on the events which can be found at SA the yellow canary .. again and then Big Batteries - big issues .
A summary of the average prices for March and then Q1 is shown below:
The average quarter prices were the lowest in years; and we have added the pre-NEM prices (i.e. pre 1999) for Vic, NSW and Qld to provide further insight of low price years since deregulation and the results show:
- Tasmania had the lowest in 10-years
- Queensland and Victoria had the lowest in 9-years
- New South Wales and South Australia had the lowest in 6-years
The interactive chart shows for each State the average Q1 prices and the dashed line marks the 2021 Q1 average price level:
Please note: We have sometimes notices on a mobile device that after selecting from the dropdown box, you have to click the box again for the chart to refresh
If you are wondering how low Q1 prices can go, have a look at Victoria in the above chart and check-out 1996 at $11.11/MWh and even lower, 1998 at $9.48/MWh. It is worth recalling that the deregulated market start date varied for each State. The first Q1 occurred in 1995 for VIC, 1997 for NSW, 1998 for QLD, 1999 for SA when the NEM was in operation, and 2006 for TAS. Technically, these early years are not comparable with prices since NEM started (Dec-98), but nevertheless are interesting.
The Risk-of-Change measures if the supply/demand balance consistently changed by 100MW for the bigger States of NSW, VIC and QLD; or 50MW for SA and TAS, what would be the price impact? The chart below shows:
- SA average March price ($68.90/MWh) was the most exposed to a high Risk-of-Change due to the critical days of 12-14 March and was in the top 3 months since January 2020
- Queensland ($45.84/MWh) had a high Risk-of-Change to soften
- NSW/VIC ($38.99/$30.39/MWh) were very resistant to change
- TAS ($30.81/MWh) was resistant to change which has been the case for all of Q1-21
The notable contribution to the average price by each Price Band for the month was:
- SA had negative prices reducing the average by $11.91/MWh, but the extreme prices above $5,000/MWh added $33.59/MWh. If it weren't for the 12 March, SA average price would have been about $35/MWh, much closer to VIC and TAS
- QLD had about $7.80/MWh added to the average due to prices in the $300 to $5,000/MWh band
The proportion of half hour negative prices continues to be material for SA with 12% of the half hours going negative. Since September last year, the monthly proportion has ranged between 22% in December to 12% in March.
Victoria had the next highest with 3.7%, and all other States were relatively minor. The following interactive chart shows for each State the history since Jan-19.
The $300/MWh cap product is traded over time, and we have assessed the financial returns of using this product versus the actual payout for Q1-21. A cap product can be used in several ways including the best value proposition when compelled to hedge, knowing it is unlikely to deliver a favourable payout. For Q1-21:
- SA cap product traded between $8.35 and $46.50/MWh on ASX Energy with an average traded price of $31.75/MWh. SA was the only region with a favourable payout, as it returned $42.83/MWh
- QLD traded on ASX Energy between $7.85 and $15.75/MWh with an average traded price of $10.19/MWh, while the payout was $7.80/MWh leading to a favourable outcome for the sellers
- TAS is not traded on ASX Energy, but is publicly offered by HydroTas before 1 January 2021. The offers ranged between $1.11 and $9.24/MWh while the average 2020 offered price was $3.31/MWh. The actual payout was $0.55/MWh leading to a favourable outcome for HydroTas
- NSW and VIC had no prices above $300/MWh, and therefore no payouts. On ASX Energy, NSW traded between $14.00 and $27.25/MWh with an average of $21.06/MWh; while VIC traded between a very wide range of $3.25 to $46.25/MWh, with an average ASX traded price of $34.36/MWh. The sellers of NSW and VIC caps had a very favourable trading strategy.
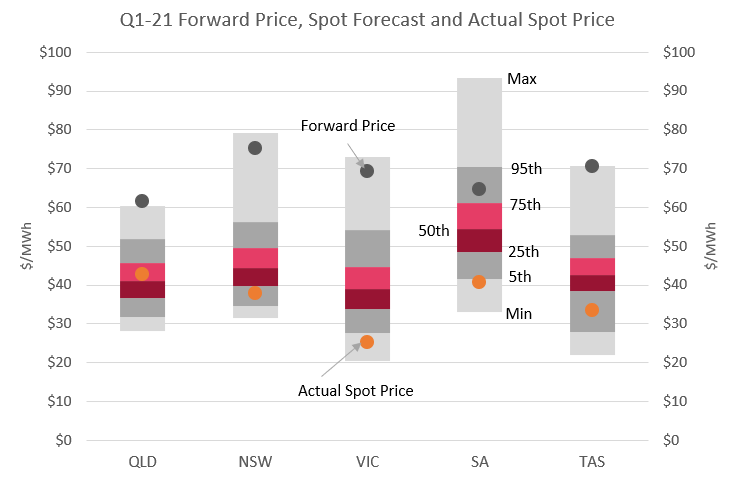
Actual Q1 spot prices were compared with our probabilistic spot forecasts prepared before the quarter commenced, along with the forward market prices just before the quarter started. The forward market reflects the risk-adjusted market expectation of spot prices, however, once again as is usually the case, the forward market was a poor predictor of actual spot prices. Our probabilistic spot forecast indicated that most States, except for Queensland, had a lower-than-expected outcome.
- our probabilistic spot forecasts are shown as a distribution with the key percentiles marked on the following graphic
- QLD average was close to our median forecast and therefore tracked to our expectation. Meanwhile, the wholesale forward price was at a 31% premium above the actual price
- NSW finished below our 25th percentile forecast reflecting a very low outcome, while the forward market was well above the actual price demanding a 50% premium
- VIC was in the lowest 5% of our forecast also reflecting a very low outcome, and the forward market had the highest premium of 64% above the actual
- SA was just below our 5th percentile, and in this case the forward market premium was 37%
- Finally, TAS finished between our 25th and 5th percentile, and the forward market premium was 52%
Each day we note pre-dispatch prices for the day looking for any price prediction above $300/MWh, so that customers can be forewarned. The actual price events are then compared with the pre-dispatch forecast.
Across the NEM, there were 24 actual half hours that exceeded $300/MWh which was the highest March since 2017, and SA recorded 14 of these cases. There were 120 cases predicted across the NEM shared between SA (47), QLD (43) and TAS (30); which compares to 39 cases in March 2020 and 163 in March 2019.
The risk of volatility in NSW and VIC disappeared for the month as evident by the pre-dispatch price forecast and the low Risk-of-Change.
5.0 Consumption & Demand
This section assesses the changes in consumption and operational demand
Total energy consumption during March showed little difference from the same time last year for Vic and NSW. While Qld and TAS had slightly higher energy consumption for the month, and South Australian energy consumption was more than 5% (51GWh) lower than the same time last year. Mostly accounted for by the massive increase in behind the meter rooftop solar PV generation which was 25% (40GWh) higher than the same time last year.

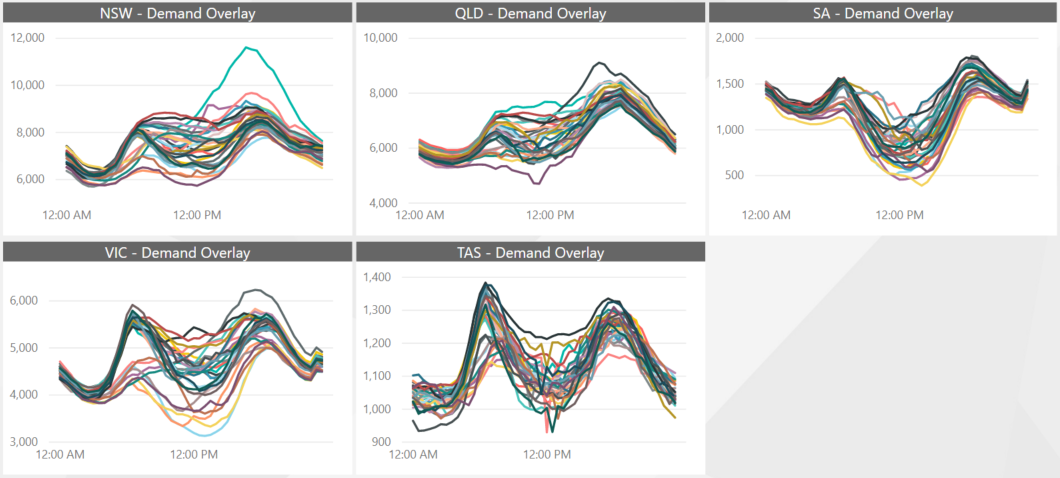
Maximum half hour demand was slightly higher than same time last year for NSW on account of the one outlier for the month on 1 March, the warmest day of the month pushing demand towards 12,000MW. Demand was significantly subdued in the rest of the NEM.
In Victoria, maximum demand was more than 8% (575MW) lower than the same time last year. SA maximum demand was a massive 16% (350MW) lower than the previous year, the intraday demand profile showing a very compact profile with no outliers. Maximum demand in Queensland and Tasmania was only marginally lower than the same time last year, both regions also showing compressed intraday profiles for the month.
6.0 Weather
The key weather highlights for the month were:
- BNE's temperatures were like last year evident by the Average Temperatures being similar, although there was a slight increase in Cooling Degree Days but the same Weather Sensitivity as last year
- SYD's temperatures were slightly higher than same time last year which was also supported by a slight increase in Cooling Degree Days, and an increase in Weather Sensitivity
- MEL had a cooler March evident by a lower Average Temperature, less Cooling Degree Days and less Weather Sensitivity due to more comfortable conditions
- ADL temperatures were like last year evident by the same Average Temperature, slightly lower Cooling Degree Days, but offset by slightly higher Heating Degree Days and lower Weather Sensitivity due to more comfortable conditions
- HBT had a warmer March evident by higher average temperatures, lower Heating Degree Days and much lower Weather Sensitivity meaning more comfortable conditions
The following tabs, along with their interactive charts, provide further detail.
The Average Temperature is used widely in the industry and is defined as the average of the maximum daily and minimum daily temperatures.
Heating and Cooling Degree days are also used by the industry to measure the amount of energy that is likely to be consumed. It is defined as the sum of the differences between the Average Temperature and 18 degrees. Cooling Degree Days are the sum of the positive values of the differential from 18 degrees, and the Heating Degree Days are the sum of the negative differentials from 18 degrees.
We have developed an algorithm that measures what we call the Weather Sensitivity where we measure the energy fluctuation that is due to weather variations. The benefit of this algorithm is that it is locational based, and not fixed on a set benchmark like 18 degrees as is the Heating and Cooling Degree Days. It is possible to apply this algorithm to any individual meter or group of meters. In this case, we apply the algorithm to the whole State.
7.0 Generator Behaviour
In this section we assess the generator behaviour that can be an early warning or confirmation of market participant strategies. The analysis is undertaken by State:
Stanwell demonstrated the most significant behaviour during the month in Queensland, by shifting capacity from low price bands into high price levels. The chart shows the average capacity for each of the price bands, and the red coloured areas for Q1-21 stand-out which represent capacity offered more than $5,000/MWh. The quantum offered in this band is far greater than the same time last year, and far greater than the previous months.
Origin Energy have publicly stated that ...
"I think it’s actually going to be a pretty messy period of time, and I think you will see us running our generation less at Eraring. That’s what you’re seeing now. We have to do enough to keep capacity available when it’s needed and manage within the flexible sort of window of that asset, but [lower generation] is going to be a feature"
- Frank Calibri, CEO at Origin Energy
We discussed this in our previous article Origin Energy flexes muscle published early March, and as an update we notice that Origin has continued with the strategy of shifting capacity into high price bands to elevate prices. The quantum of capacity in the above $5,000/MWh price band has materially increased.
In Victoria, there was not too much of a change with the key points that:
- AGL has offered more capacity on average in the last 2-months, and generally the additional capacity has been in higher price bands
- Origin's gas plant is being offered at extreme prices only, given the current market prices are below the production costs and the public strategy of wishing to increase spot prices
The key event in SA was the 12 March event when prices escalated. On that day, capacity offered in the lowest price band increased steadily peaking at 18:30 hours and remained at high levels through the first extreme price run. As the evening progressed, more capacity was offered in the above $5,000/MWh band.
The quantum of capacity offers in Tasmania have tended to increase in the lower price bands over the last 2-months, contributing to the low spot price outcomes in the State.
8.0 Forward Prices
This section looks at the next financial year in detail, and then the next 3-financial years in the context of history.
Falling forward market prices has been a feature in our previous monthly reports with Vic and SA leading the charge downwards. FY-21/22 forward prices reached a floor late in February and rebounded slightly during March. For FY-21/22:
- Vic and SA uncharacteristically maintained the lowest forward prices comfortably below $40/MWh
- Queensland closed the month at just below $40/MWh
- Tasmania had the second highest, finishing just above $43/MWh
- NSW remains the highest and finished at the end of the month just under $50/MWh.
The forward prices for the next 3-year consecutive years is setting records with:
- never in SA, has the next 3-years forward price been as low as current levels
- TAS has the lowest outlook for the next 3-years since the establishment of the Wholesale Contract Regulatory Instrument which is the mechanism to set the wholesale forward prices in Tasmania, became effective in January 2014
- VIC and QLD has the lowest 3-year outlook for the next 3-years since 2005. In real terms, current prices are the lowest since the commencement of the NEM
- NSW prices are stronger than other regions and has the lowest next 3-year outlook since 2014
The following chart shows the historical range of financial year forward prices and the line represents the latest price prior to the commencement of each year.
9.0 Generation
There have been 3 additional renewable generators come online during the month and these are:
- SA solar farm Morgan Whyalla PS 1 and PS2 which are part of the small 7.5MW installation by SA Water
- Victorian Winton Solar Farm (85MW)
By controlling the time bar on the top of the chart, will open up the date range to show all first generation dates.
Looking at the trends of generation across the NEM by technology:
- Batteries, although small, on average have doubled since same time last year
- Black coal has been reasonably consistent since November last year around 11,000MW, but much lower than same time in previous years
- Brown coal has stepped up since January this year and March averaged 4,200MW
- Gas is operating about half the level of 2019 and reasonably consistent at 1,100MW over the last 3-months
- Rooftop solar continues to grow from same time last year and averaged 1,665MW (measured on all hours) in March
- Utility scale solar farms have increased markedly this summer and averaged 1,000MW measured on all hours
- Wind farms have increased markedly this quarter compared to same time last year and averaged about 2,200MW in March
We have assessed the annual wind generation since 2010, and the first 3-months of 2021; along with the average dispatched price, average spot LGC price and the time weighted spot price.
The SA wind farm price gap measured as the difference between the time weighted average price and dispatched weighted average price has widened. For Q1-21, the average price was $40/MWh, while the wind farm average was only $23/MWh. Such a gap is similar to the 2017 to 2019 era, but the price is much lower.
The bundled SA price of power plus spot LGC is more than $56/MWh for 2021 so far, the lowest in the 11-year history.
You can toggle through the chart to view the other States, with other highlights being:
- QLD wind generation is growing but remains small and therefore is not impacting the averages yet
- So far this year, NSW wind average has been remarkably similar to the time weighted average price
- VIC wind average price is low, but the discount from the time average price is not as bad as other years, but prices are low at $25/MWh
- SA wind average price continues to be low at $23/MWh compared to a year-to-date $40.52/MWh time weighted average
- TAS wind average was $27.76/MWh against a time weighted average of $33.52/MWh, with the gap smaller than previous years, but at a much lower price as wind generation grows
Looking at solar farms, the dispatched average price for SA solar farms for Q1-21 was only $12.97/MWh, falling from $32.48/MWh in 2020. The bundled price is about $47/MWh.
Other highlights are:
- VIC solar farm Q1-21 average was only $14.24/MWh and SA was only $12.97/MWh
- NSW solar farms are more resistant to being heavily discounted from the time weighted average, for example Q1-21 average was $37.67, but the solar average was $31.20/MWh
- QLD is following NSW by being more resistant, but the ramp-up of solar generation is steep and no doubt will adversely affect the solar average
Generator base load outages key outcomes for March were:
- QLD in 2021 had a higher average level of outages and always had an outage throughout the month, which was contrary to the previous 2-years
- NSW had an outage level lower than 2020, but similar to 2019. Throughout the month, there always was an outage which was not the case in the last 2-years
- VIC had an average outage level lower than last year, but more than 2019
10.0 Water Storages
Water storage levels for March were higher for Snowy Hydro compared to the past couple of years, largely due to high rainfall levels in recent months. Hydro Tasmania's storage levels also remain comfortably above the deemed Prudent Storage Level which is around 30% for this time of the year.
11.0 Ancillary Services
NEM Frequency Control Ancillary Service costs continued the trend of Q1 of materially being lower than the records set in 2020. March costs were $15.1m which compared with $32.8m for the same time last year.
SA represented the lion share with $7.2m, followed by TAS at $2.4m, NSW at $2.2m, QLD at $1.8m and VIC at $1.5m.
12.0 Gas Market
Asian gas spot prices took off during February, whereas domestic gas spot prices remained unaffected. All gas supply hubs have seen prices soften in recent months, with spot prices around $6/GJ for Brisbane, Sydney and Adelaide, while the Victorian Declared Wholesale Gas Market has the lowest post price around $5.50/GJ for March.
13.0 Enviro Certificates
In the national certificate spot market, Large-scale Certificate (LGC) prices continued to soften early in March to below $32/certificate and then strengthened slightly towards the end of the month. Small-scale Certificate (STC) prices rallied by around $1/certificate to close the month just under $39/certificate.
In the state certificate spot market, following a massive rally in January, Victorian Energy Efficiency Certificate (VEET) prices took off beyond $50/certificate. The shortfall in VEET certificates is largely due to the restrictions affecting energy efficiency installers during the pandemic as well as announcements from the Victorian Government regarding upcoming changes to the scheme. VEET certificates received from residential lighting installs was reduced by 35 per cent on 31 Mar 2021 and will be completely phased out on 31 Jan 2022. Commercial lighting saw a 15 per cent reduction on 31 Mar 2021, with a further reduction slated for 31 Jan 2022 and will be removed completely on 31 Jan 2023.
NSW's Energy Saving Certificate (ESC) also saw a sharp rally early in the year, but price increases were more subdued during March, closing the month at $30/certificate.
LGC forward prices had been tracking downwards during January and February, but this trend turned around early in March with prices climbing steadily from mid-March.
- Cal-21 LGC forward price closed the month at $33.13/certificate
- Cal-22 rallied to close at $26.63/certificate
- Cal-23 ended the month at $18.38/certificate
- Cal-24 closed just under $10/certificate
- Cal-25 forward price hovered around $6/certificate
14.0 Weather Outlook
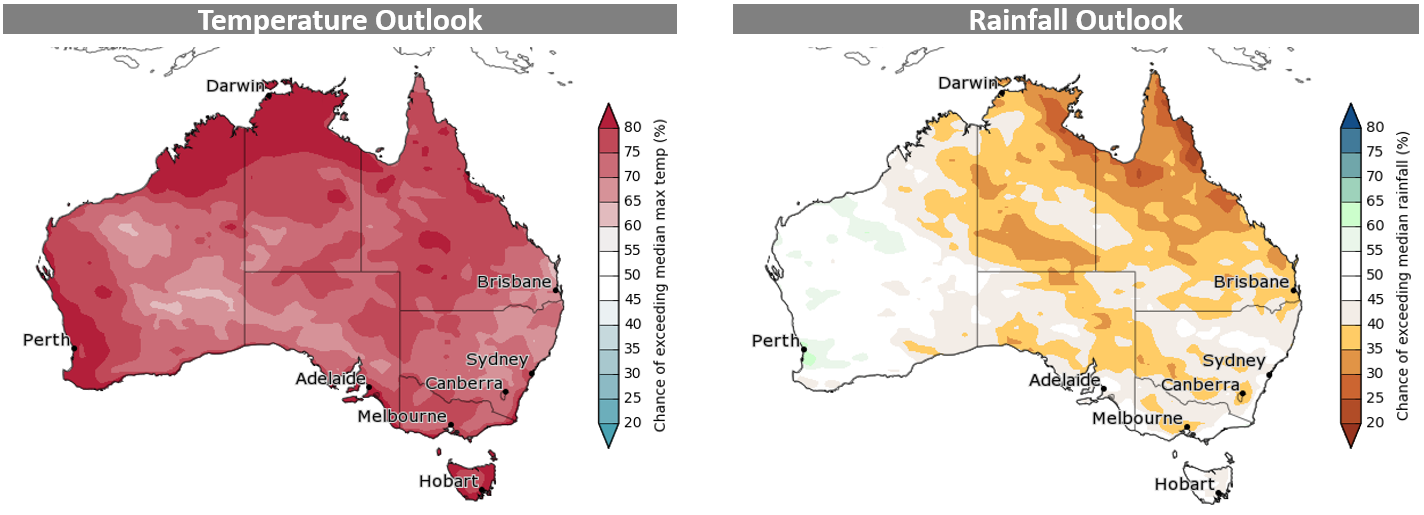
The Bureau of Meteorology's 3-month outlook is showing warmer temperatures across the country. Tasmania, the Top End and south-west WA show an 80 per cent chance of exceeding median maximum temperatures, while the rest of the country shows a 60-70 per cent chance of exceeding the median.
The rainfall outlook is showing drier conditions for most of northern Queensland, the Northern Territory, Melbourne and Central Victoria, Canberra and the Riverina in NSW. The remainder of the country is showing around 50 per cent chance of exceeding median rainfall levels.
15.0 Feedback
Thank you for reaching the end of our report, we hope you have learnt something and have enjoyed the read and rich interactive charts.