Welcome to our monthly market report for the month of May 2020 and we hope everyone is keeping healthy from the COVID 19 pandemic, and not too badly impacted. This month’s special features include:
- A summary of the Technology Roadmap released by the Federal Government
- A pictorial snapshot of the demolition of the chimney stacks at Hazelwood Power Station and a recap of the plant’s history and contribution
- An update from last month’s assessment of the COVID 19 pandemic impact on the daily demand profile
- An assessment of the Price Setter results for 2020, in the context of the history dating back to 2009
- A measurement of the potential additional LGCs that may be created from so called ‘old’
hydro stations if they exceed their long term baseline, which they are on track to do so
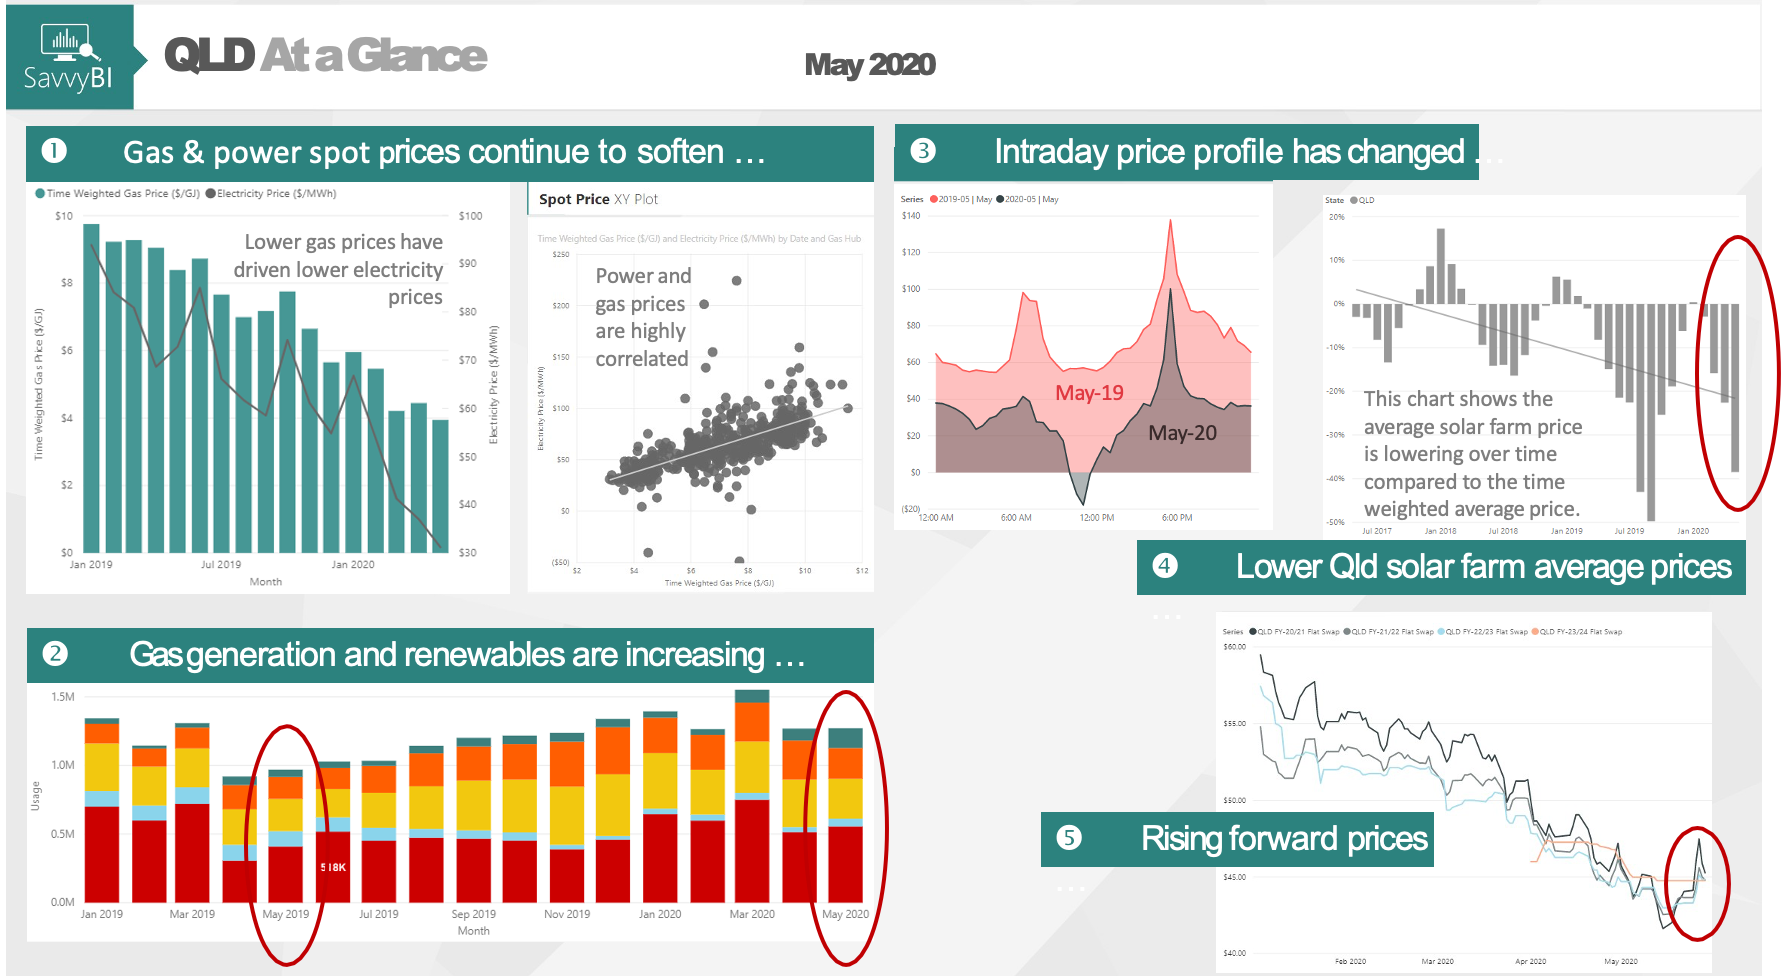
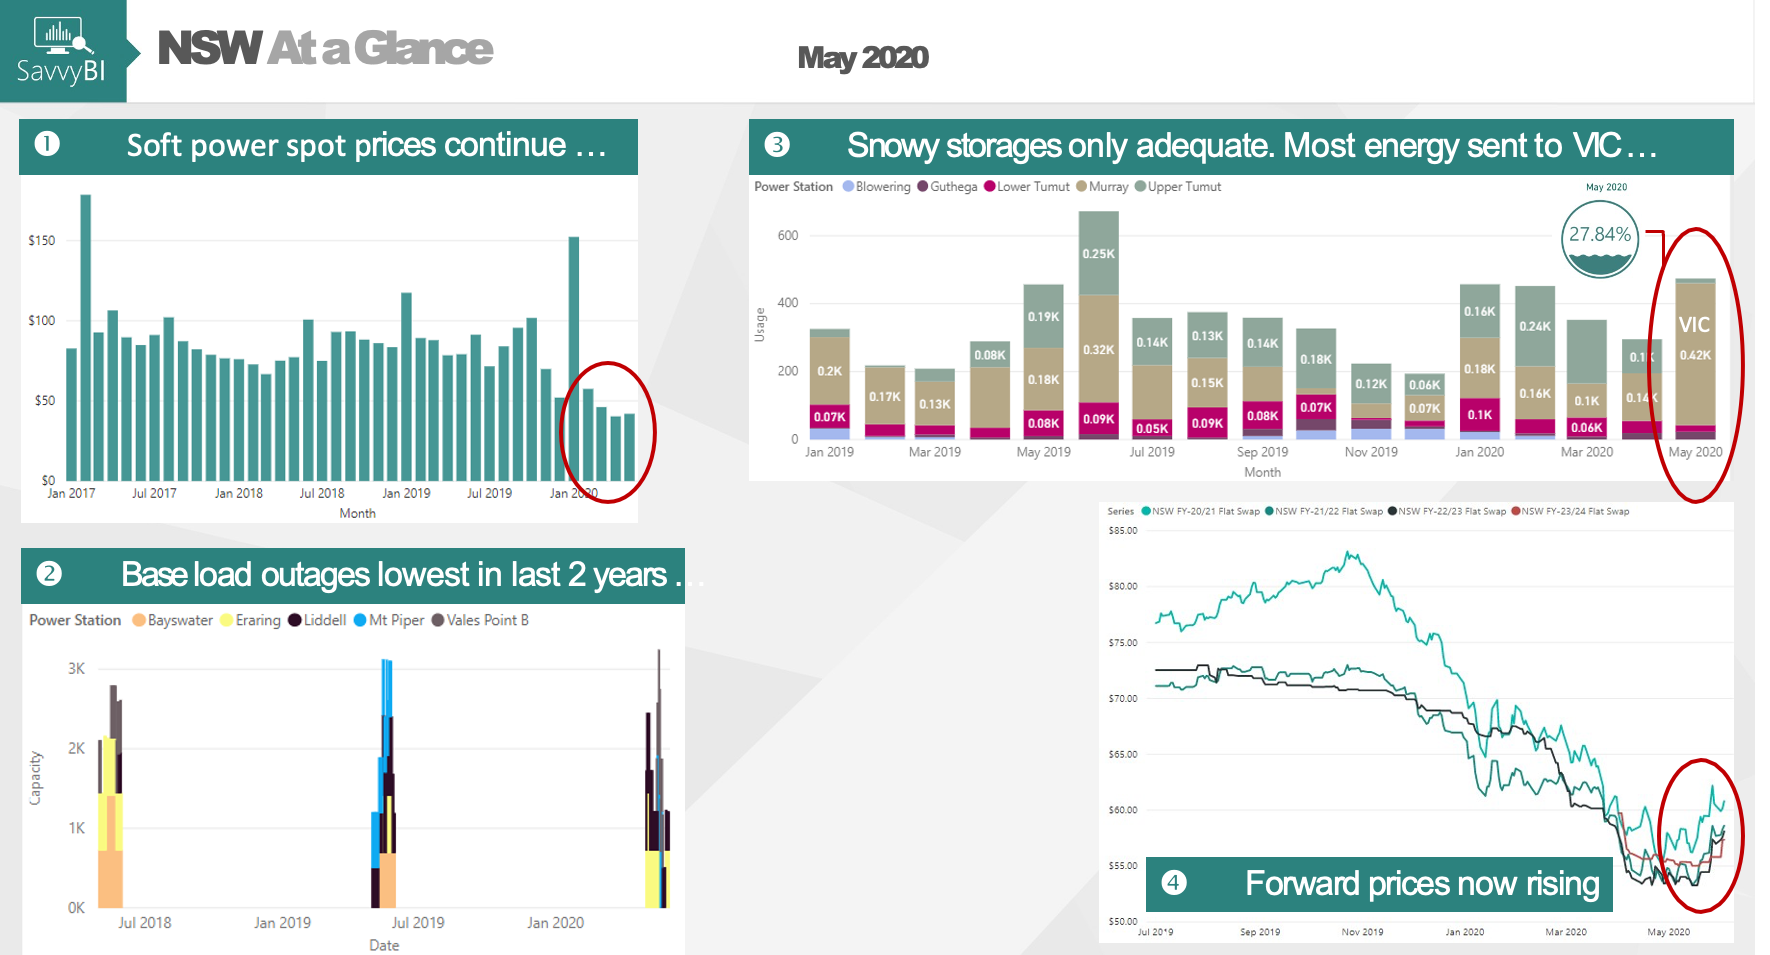
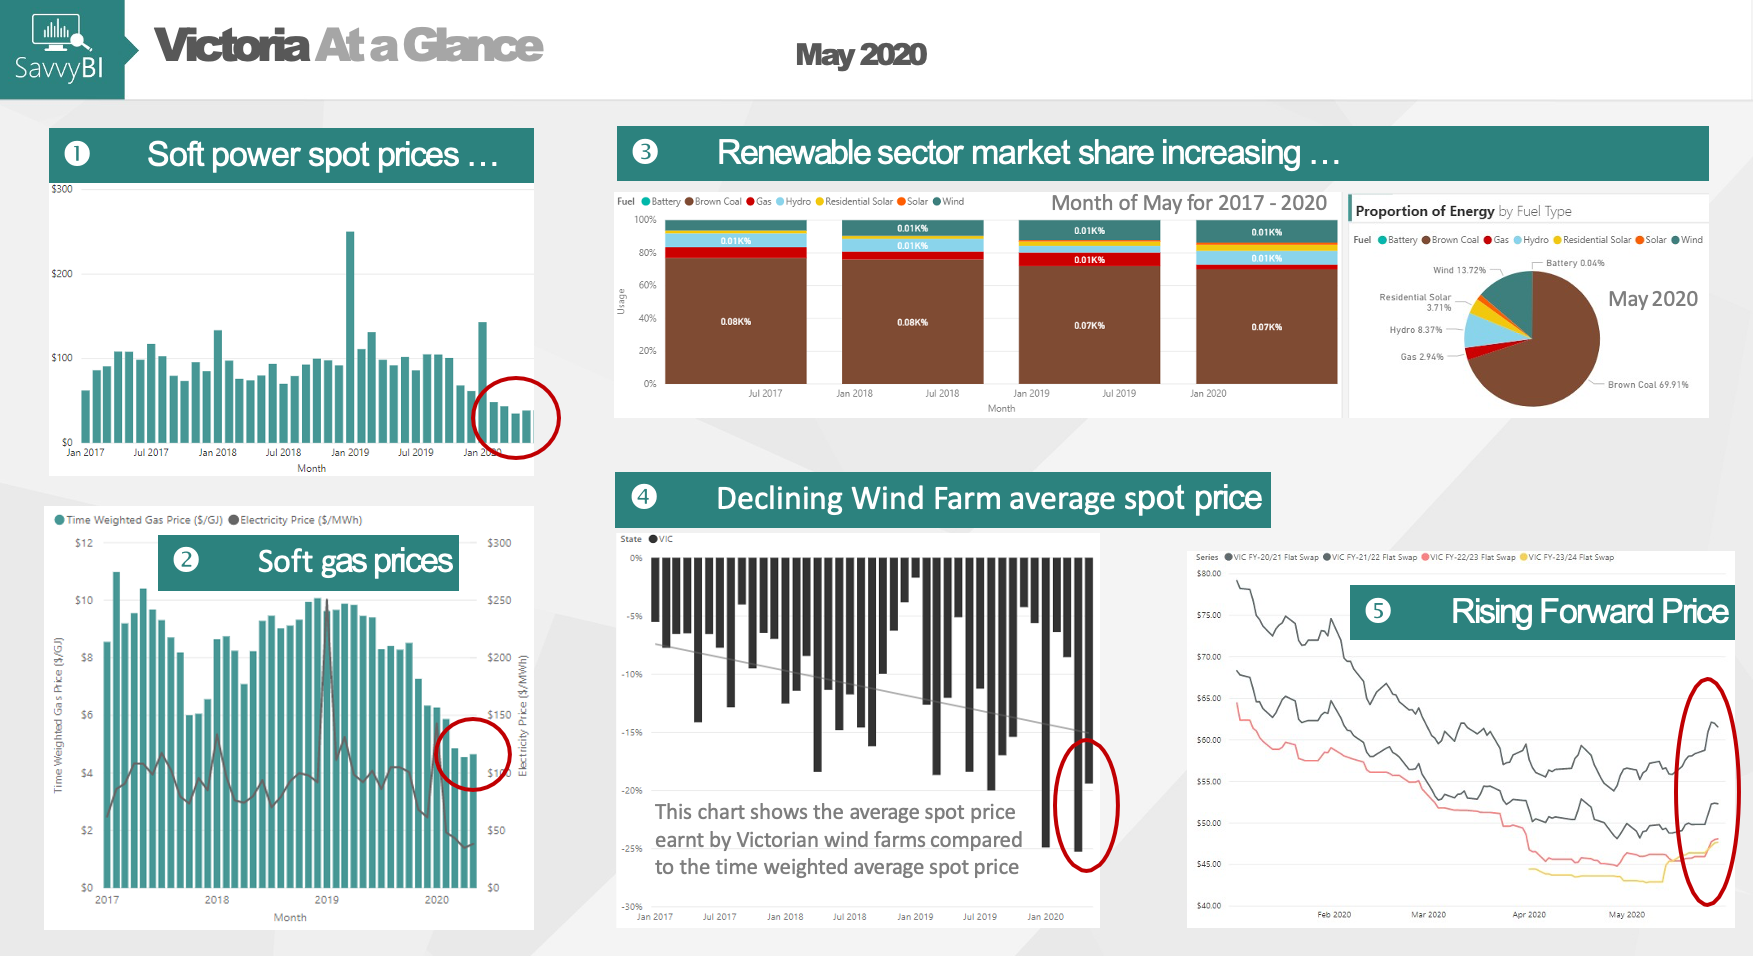
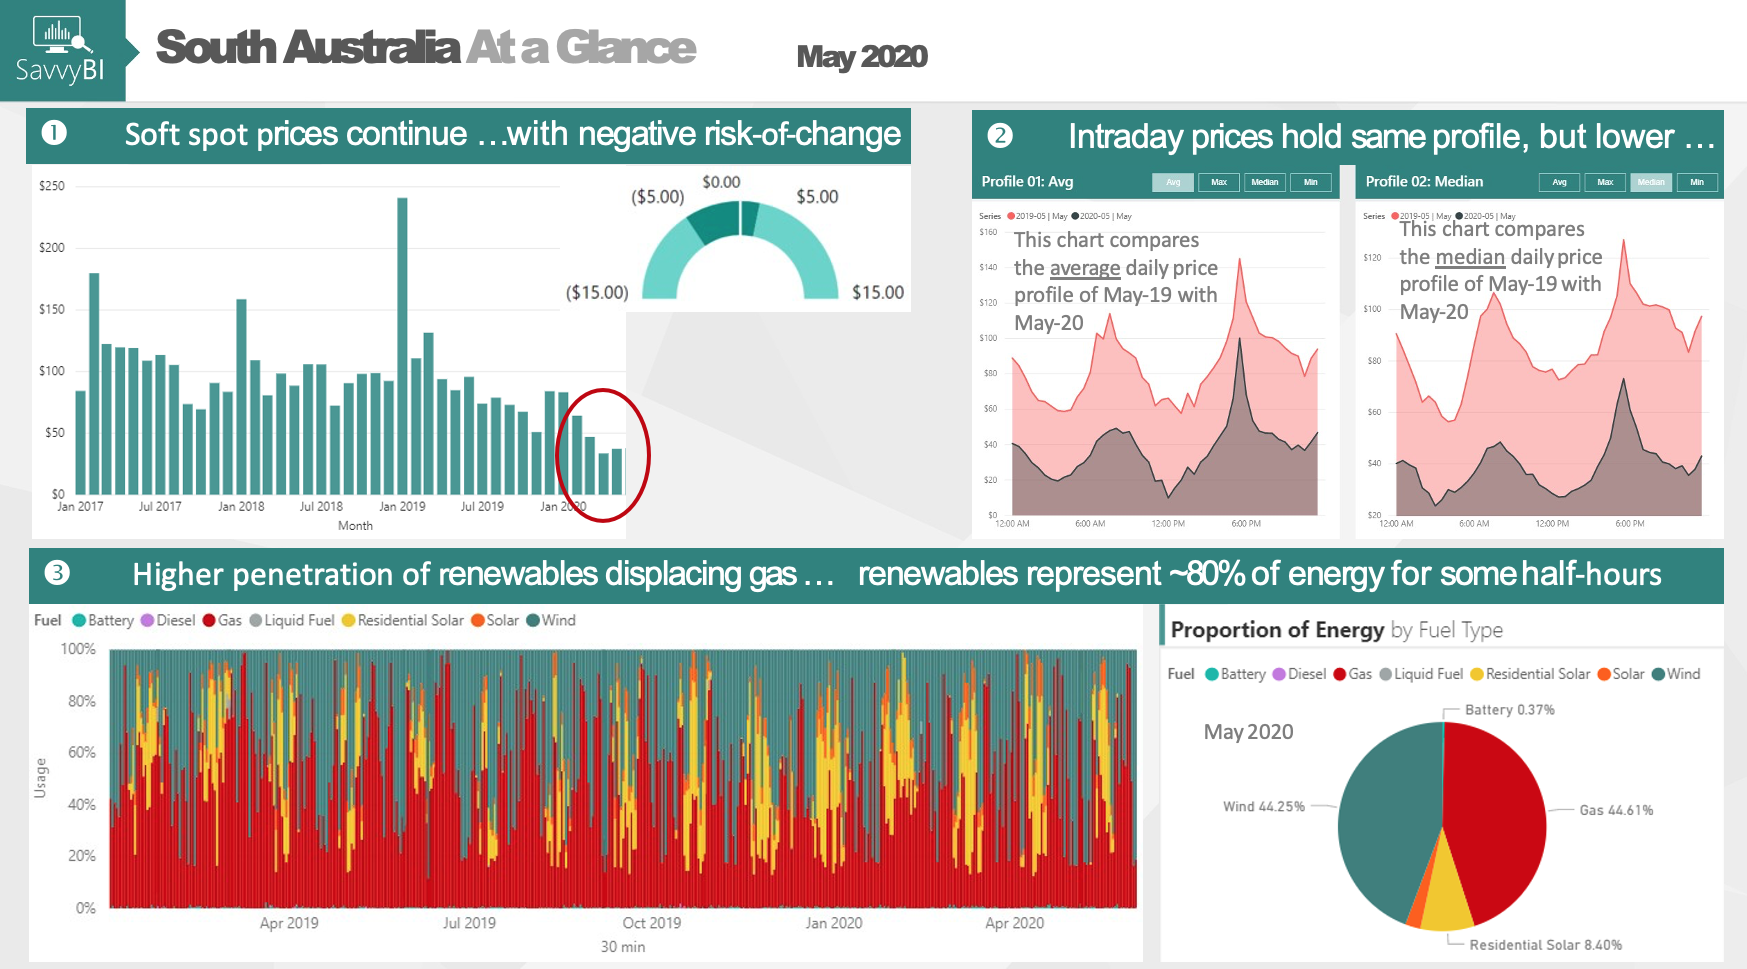
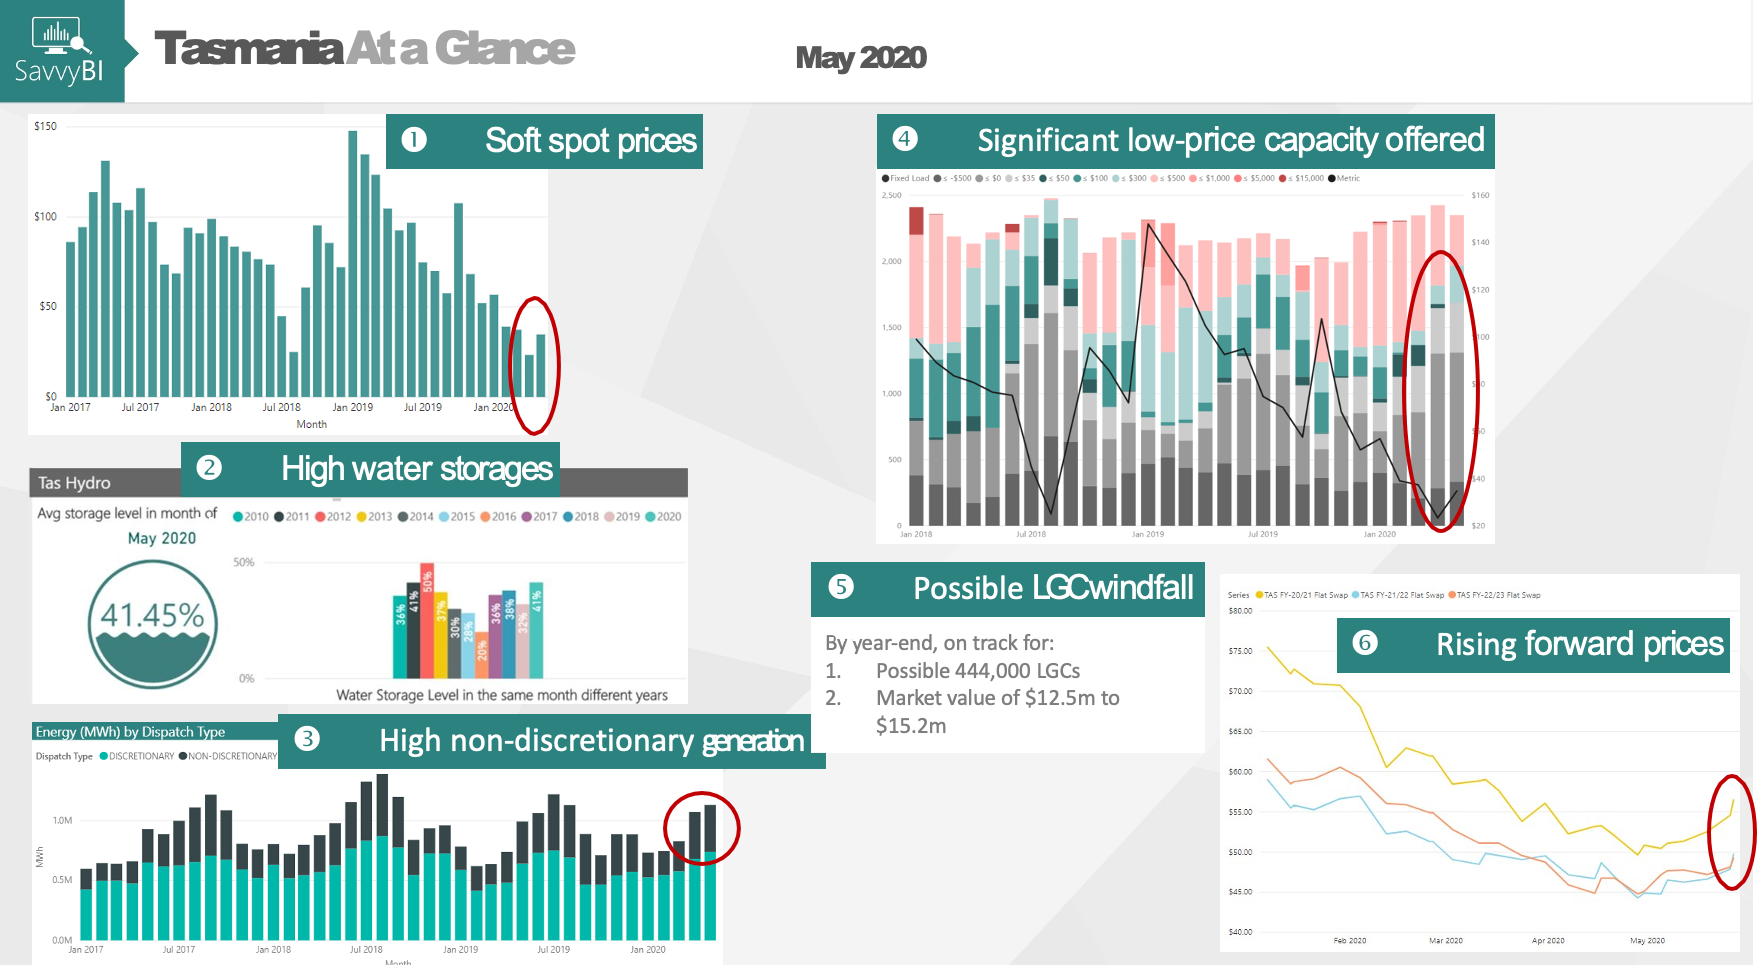
We have also introduced an “At a Glance” summary page for each Region of the NEM depicting the main 4 or 5 events of the month affecting that Region. There is a common theme that spot electricity and gas prices remain soft, although the forward market for the later years is rising.
Market Highlights
The key market highlights are:
- After three months of the lowest wholesale electricity spot prices since 2015 or 2016, average spot prices increased compared to the previous month for all regions except QLD. The lower spot prices have been driven by large capacity offers in low price bands
- Spot prices remain in the bottom quartile of our Q2 forecast
- The average wholesale gas price across the country remain at all-time lows during May
- After six months of softening prices in the electricity forward market, prices rallied during May for all regions. Our forecast models have been predicting this rally for some time, and now it appears to be happening
- Average temperatures for May were lower for all regions compared to the same time last year. The aggregate NEM weather exposure increased from 6.8% in April to 9.2% for May.
- During May there were minimal changes in the share of total NEM generation and base load outages were the lowest level for this time of year, for the last 3-years
- Above average rainfall for Victoria and southern NSW resulted in a substantial increase in Snowy Hydro’s water storage during May
- Hydro Tasmania’s water storage increased over the month, despite an increase in dispatched generation during the month
- LGC spot price rose slightly during the month and the STC price remained flat
Market News
Market News items are listed in the report, and late breaking news relate to the potential sale of Infigen Energy while Amaysim has been reported to be saying that they are open to selling its energy business (Click Energy). Origin Energy has been reported as the leading suitor.
On the corporate Power Purchase Agreement landscape:
- Our partner assisted Procurement Australia to facilitate the establishment the execution of 10-year power purchase agreements (PPAs) with 13 Victorian councils and 1 State Government Authority. Spokespeople from both Alinta Energy and Procurement Australia said they were excited and proud of the agreements. The Bald Hills Wind Farm in Gippsland, an accredited GreenPower generator, will supply large-scale generation certificates to meet the specific renewable energy requirements of each signatory. The agreements are effective from 1 July 2020.
- Swinburne University announced a 15-year PPA with Infigen Energy using the Cherry Tree wind farm near Seymour in Victoria. It has been reported that the PPA covers 100% of its power consumption with renewable energy. The agreement becomes effective 1 July 2020.
Australia's Technology Investment Roadmap
Discussion Paper
The Federal Government is developing a national Technology Investment Roadmap. The aim of the roadmap is to help prioritise Australian investments in new and developing low emissions technologies and work towards clear priorities over the short, medium and long term.
On the 21 May 2020 the government released the Technology Investment Roadmap Discussion Paper,
inviting stakeholders to share their view on the proposed roadmap by the 21 Jun 2020.
The current roadmap is underpinned by an economy-wide survey of over 140 new and emerging technologies. The survey found a range of technologies across all sectors of the Australian economy with the potential to improve productivity, lower costs, reduce emissions and support secure energy supply.
Stakeholders are invited to share their views with respect to:
- challenges, global trends and competitive advantages we should consider in setting Australia’s technology priorities
- the short-list of technologies Australia could prioritise for achieving scale in deployment through its technology investments
- goals for leveraging private investment
- what broader issues, including infrastructure, skills, regulation or, planning, need to be worked through to enable Australia to adopt priority technologies at scale while maintaining local community support
- where Australia, including its regional communities, is well-placed to take advantage of future demand for low emissions technologies, and support global emissions reductions by helping to deepen trade, markets and global supply chains
Written submissions can be provided to the Department of Industry, Science,
Energy and Resources by 21 June 2020.
Demolition of Hazelwood
Hazelwood Story
In 1949 the development of new brown coal reserves in the Latrobe Valley started by the State Electricity Commission of Victoria, was the foundation of what would supply the new power station to be known as Hazelwood Power station.
Approval for the construction of the plant was granted in 1959. The initial design had six (6) 200MW generators with a combined output of 1200MW, which was to be Victoria’s largest power plant at the time. The first generator was completed in 1964, the following 5 generators would be completed by 1971. However, due to the increased electricity demand in Victoria an additional two (2) generators were built and the previous end date moved up to 1969 with the two new units completed in 1970 and 1971. The final output of the 8 generators was 1600MW which supplied up to 25% of Victoria’s energy needs.
In 1996 the power station was privatised under the Kennett government and sold to the International Power company PLC which was part of the GDF SUEC group now known as ENGIE and held majority (91.8%) of the shares with the remainder owned by the Commonwealth Bank of Australia (8.2%). The sale to International Power extended the lifetime of the plant due to an $800 million investment to keep the plant operational and the successful application to extend the mining license which ensured coal supply until 2030. Otherwise the plant would have been decommissioned in 2005.
The power plant had been listed as the least efficient power plant in the Organistion for Economic Cooperation and Development (OECD) nations by WWF Australia. In 2010 a study by The Climate Group showed that the plant had the highest emissions intensity in Victoria with 1.37 tonnes of CO2e/MWh and it produced 15.70 million tonnes CO2e emissions.
The annual generation which can be seen in the chart to the right shows that Hazelwood produced between 11,300GWh to just over 12,000,GWh annually from 1999 until 2011, with generation peaking in 2011 at 12,041GWh. From 2012 generation began to decrease with the introduction to the Carbon Tax which started in July 2012. The carbon scheme continued until mid 2014 when it was abolished however, generation continued to decrease due to the age and reliability of the power plant.
In November 2016 Engie announced that the plant will be decommissioned in March 2017. On 25 May 2020 the 8 chimney stacks, which have stood for over 55 years and were 137m tall were demolished in just over a minute. Our previous slide showed the demolition in action, whilst the remainder of the demolition is expected to occur over the next few months.
COVID-19 Demand Impact
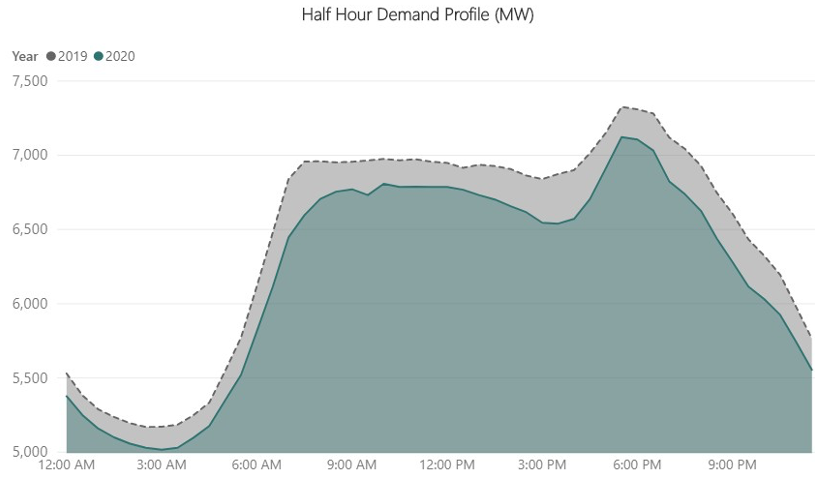
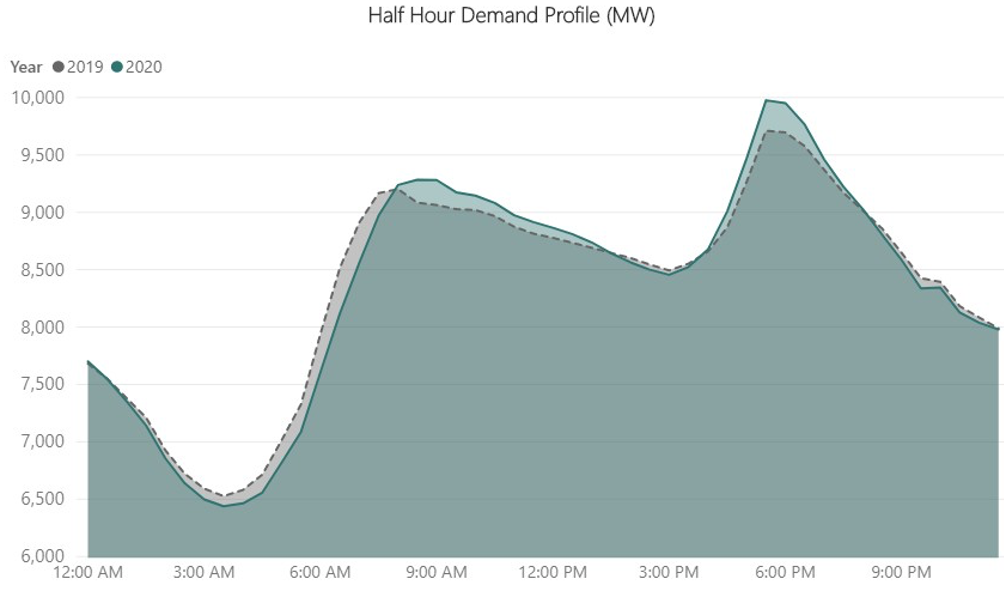
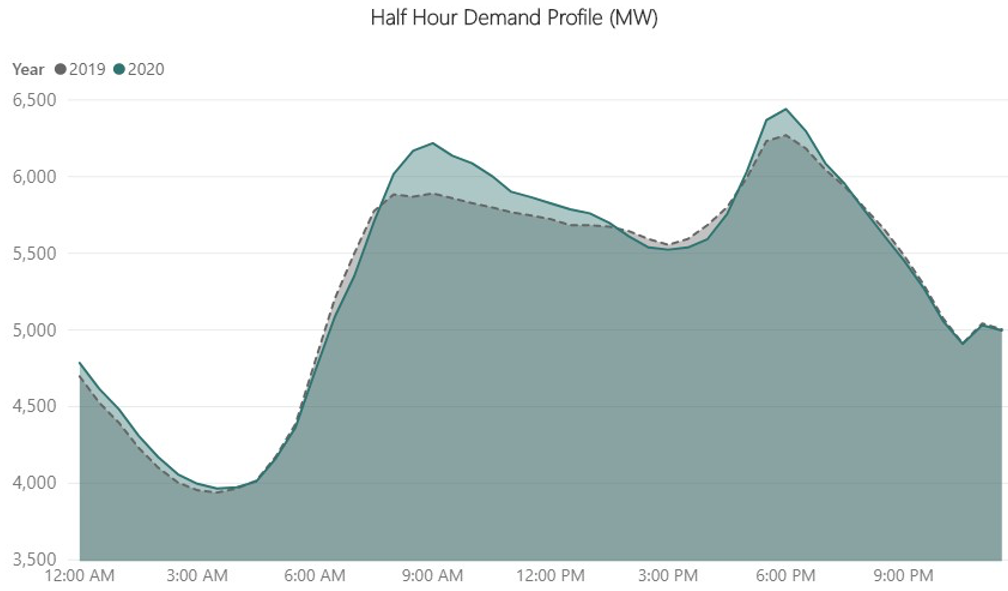
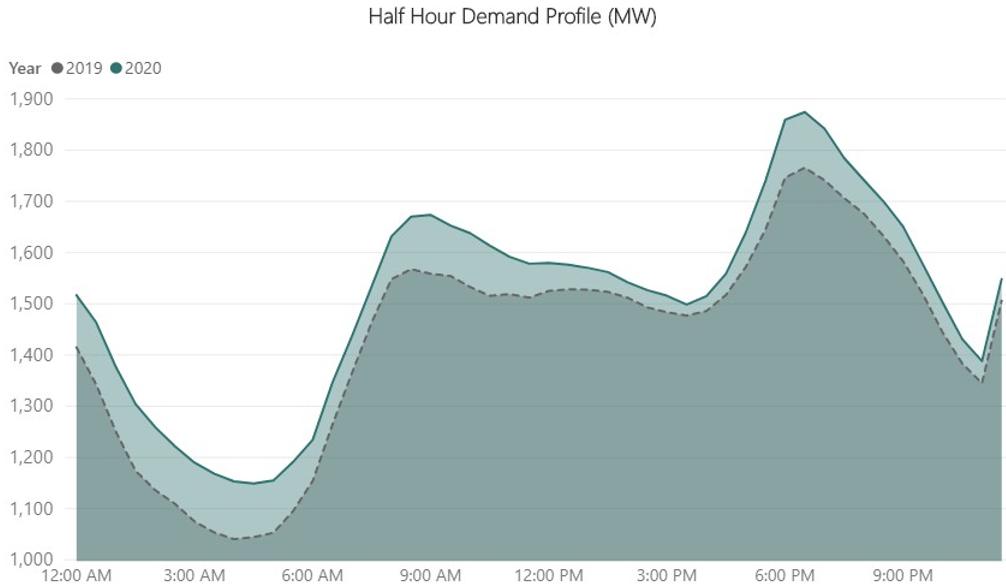
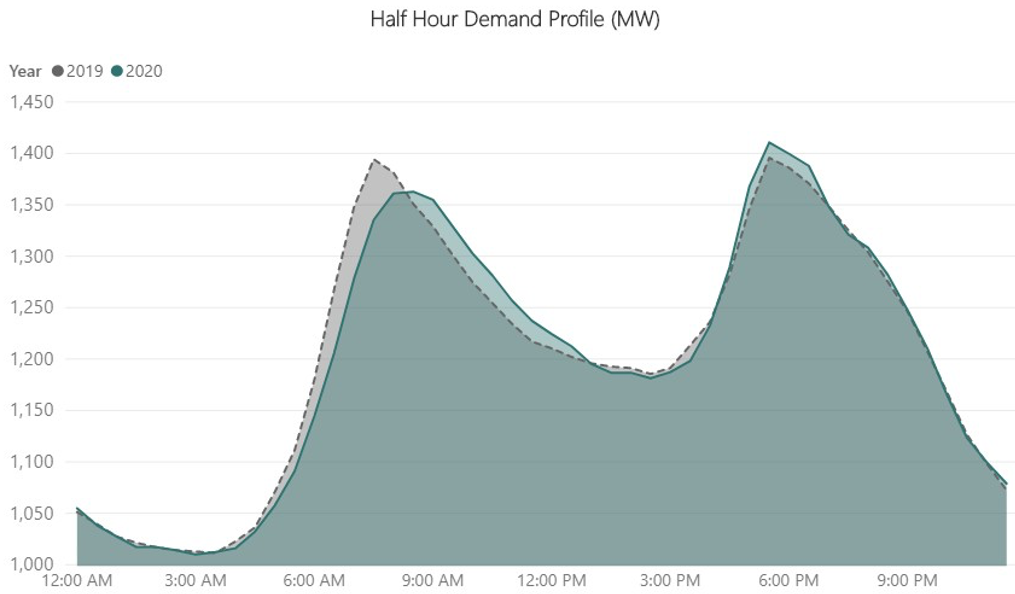
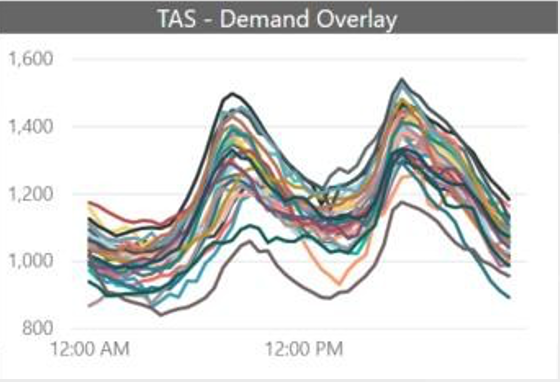
Last month, we observed it appeared COVID-19 was impacting the morning peak demand, causing the critical peak to occur slightly later. Our hypothesis was supported by the impact of home office working, and less travellers on electrified public transport.
Moving into cooler weather and even after considering May-20 average temperatures were cooler than May-19, the impact of COVID-19 is becoming clearer. This analysis considers solar PV and focusses on working weekdays.
Price Setter Analysis
Technology
Across the NEM in 2019, coal generation was deemed as the Price Setter on 57% of the time, followed by hydro (22%) and gas (20%).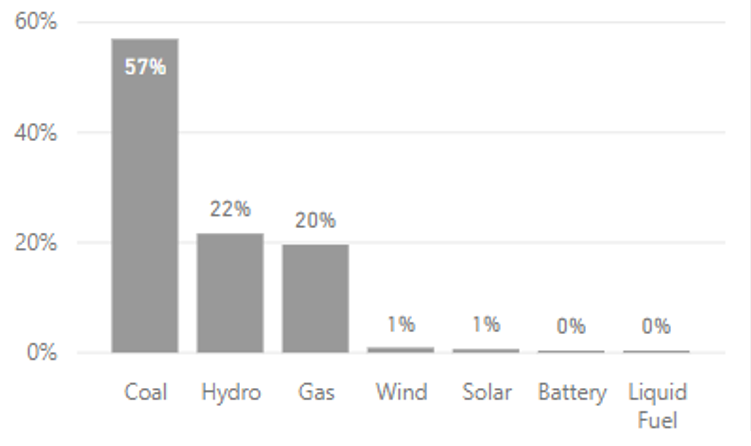
Ownership
In 2019 across the NEM, assets owned by AGL were the most dominant Price Setter (21%), followed by the Queenslanders of Stanwell (18%) and CS Energy (13%).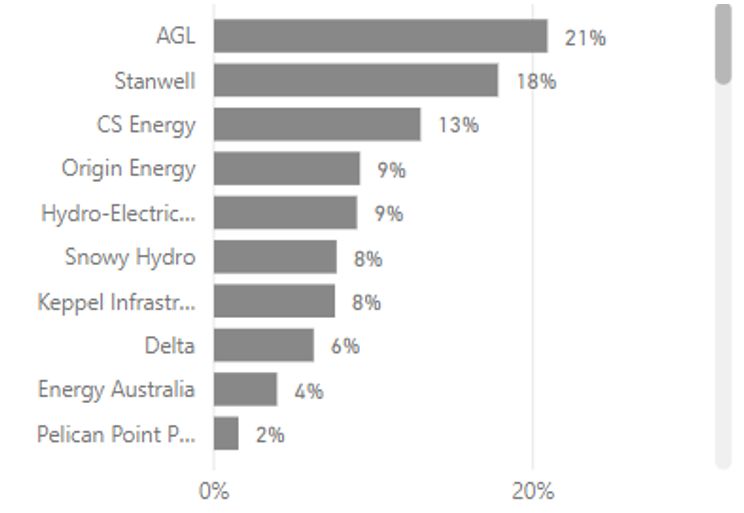
Price Setter Long Term Trends
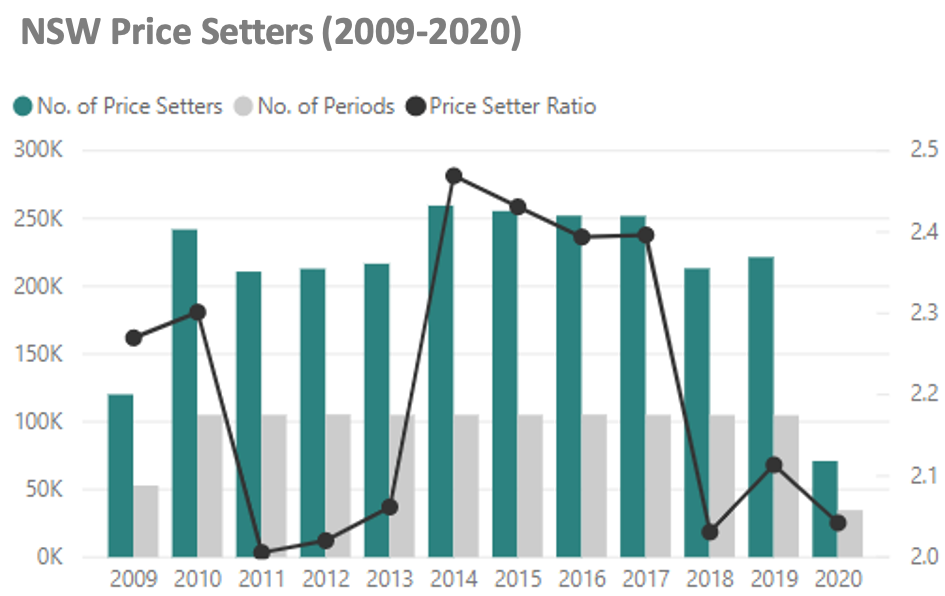
When the spot price is set for each 5-minute period, it is possible that many offers set the marginal price, which we call the Price Setter Ratio.
Looking at the Price Setter Ratio since 2009, NSW is fairly typical of other Regions, where the Price Setter Ratio markedly increased through the 2014 to 2017 period from the 2011– 2013 period.
However, since 2017 (following the closure of Northern and Hazelwood), the Price Setter Ratio has decreased, suggesting those setting the price, have less competition.
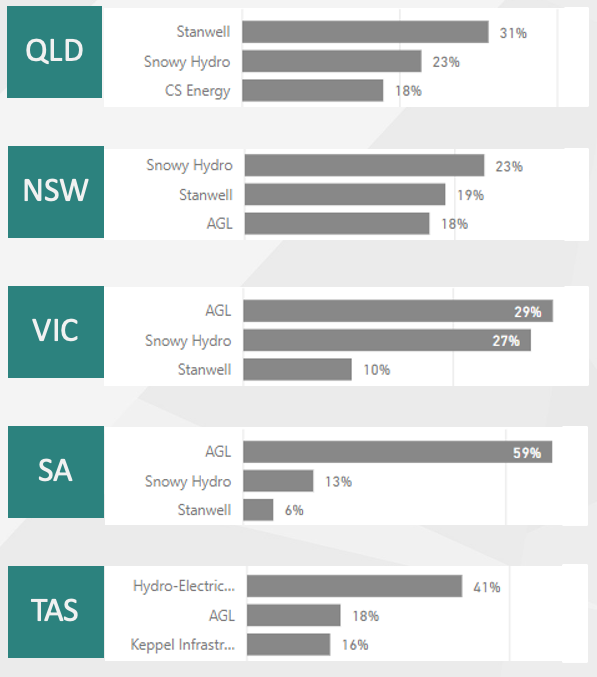
Above $300/MWh Price Setters in 2019 and 2020
The top 3 Price Setters during 2019 and 2020 when spot prices were above $300/MWh for each Region are shown below, where AGL continues to be a dominant player, followed by Snowy Hydro.
State by State at a Glance
Electricity Spot Price
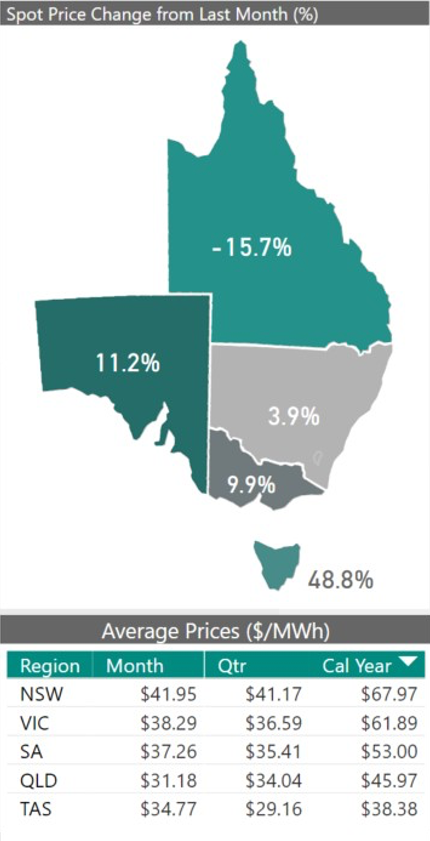
After three months of the lowest wholesale electricity spot prices since 2015 or 2016 for the majority of NEM regions, average spot prices increased compared to the previous month for all regions except QLD, where the average price for May was almost 16% lower than the previous month and the lowest price for May since 2015 at $31/MWh.
The average price for May this year was on average, half the average spot price of the previous three years for across all regions. NSW had smallest increase compared to the previous month but remains the most expensive power price at $42/MWh. VIC and SA saw increases of around 10% compared to the previous month, with average spot prices around
$38/MWh. Tasmania saw the largest rally in the spot price, up almost 50% from last months historical low of
$23/MWh to almost $35/MWh.
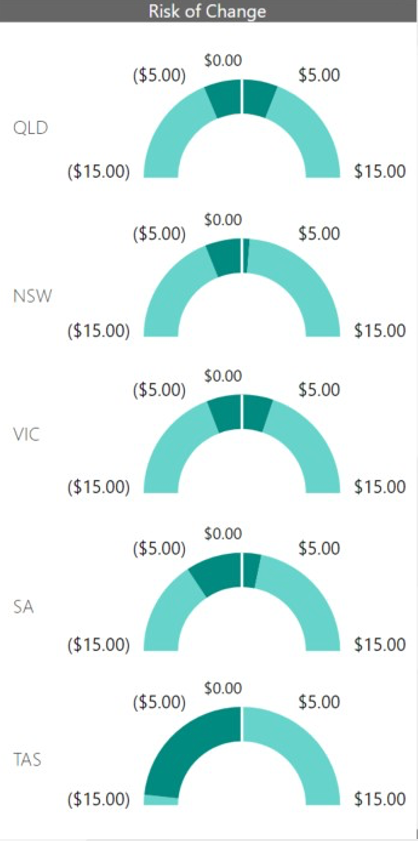
The risk-of-change is used to measure the potential price outcome for a relatively small change in demand (i.e. +/-100MW) in all states, except for SA and TAS which is +/-50MW.
The risk-of-change metrics remain similar to the previous month, with the mainland states showing little risk-of-change in the spot price. Tasmania is now showing an increased risk-of-change for lower spot price outcomes.
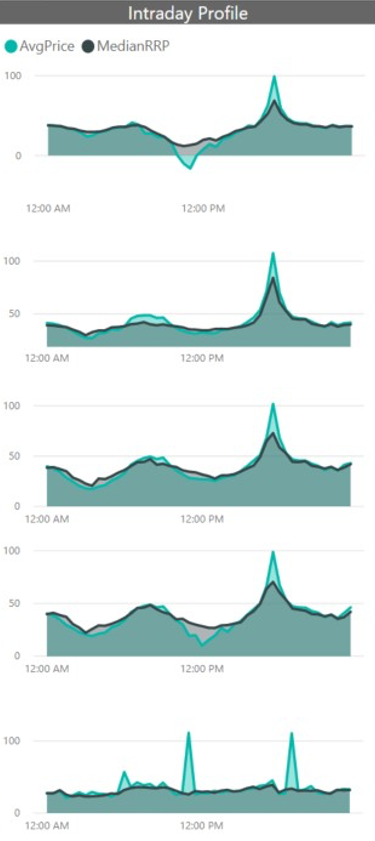
In the intraday spot price profiles to the far right, QLD shows low average price around 10:30am due to extreme negative price outcomes on 2-May when the average price fell to minus $700/MWh. All regions show high average spot prices during the evening peak corresponding to days when half hour spot prices went to $200-300/MWh.
Q2-20 Spot Price Forecast
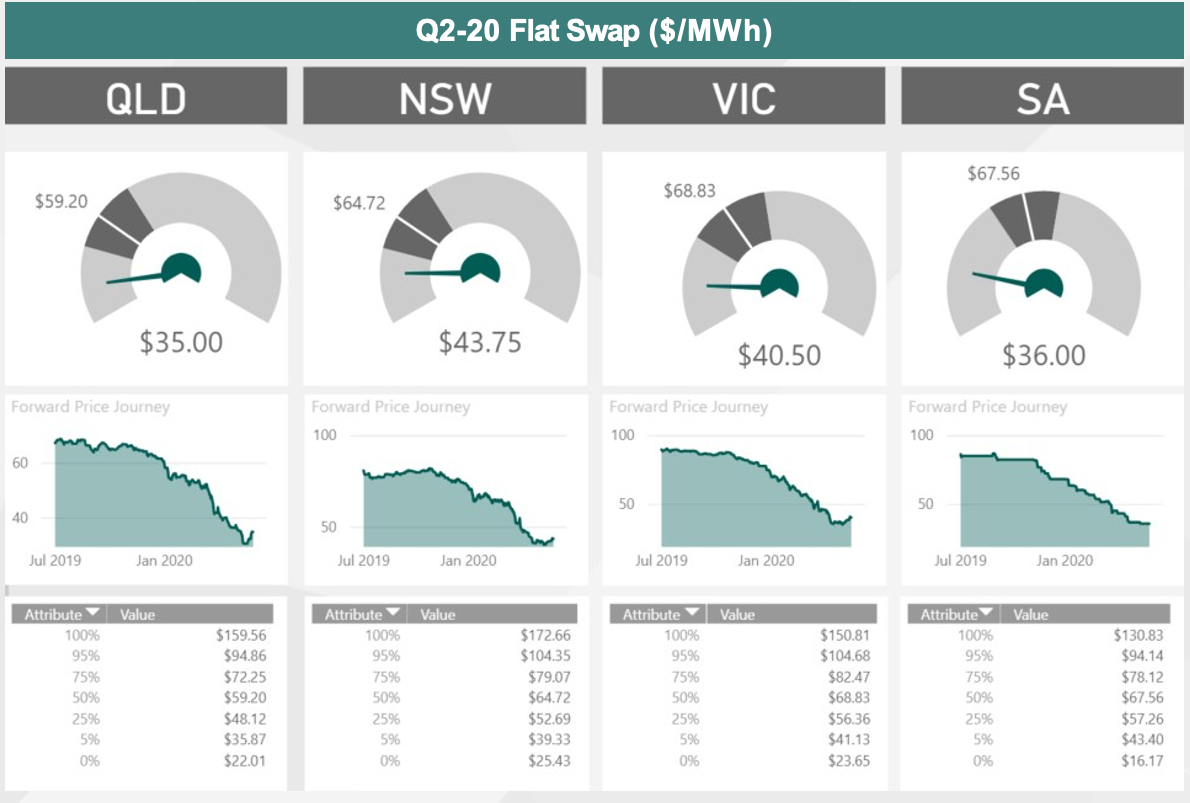
The dials to the right compare the current Q2-20 forward price against our spot forecast prepared in Q1-20. All regions are tracking in the lowest quartile of our spot forecast.
The lower and upper extremes of the dark grey area mark the 25th to 75th percentiles respectively, and the median is marked as the break in the dark area.
Electricity Demand
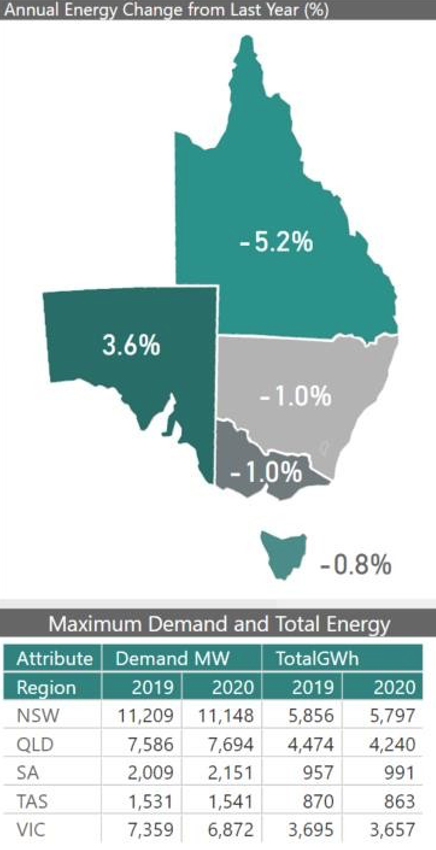
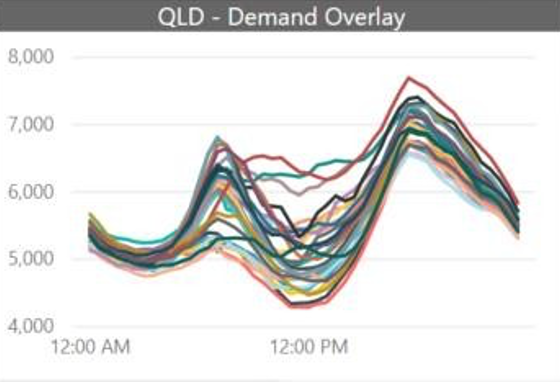
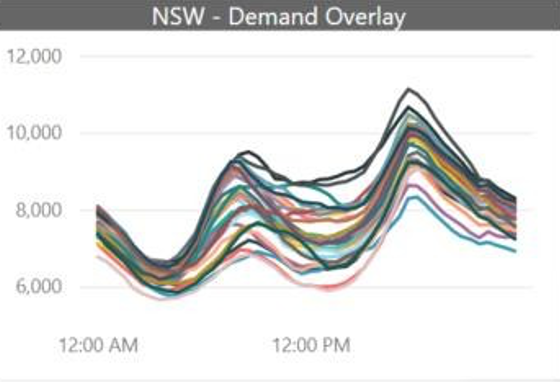
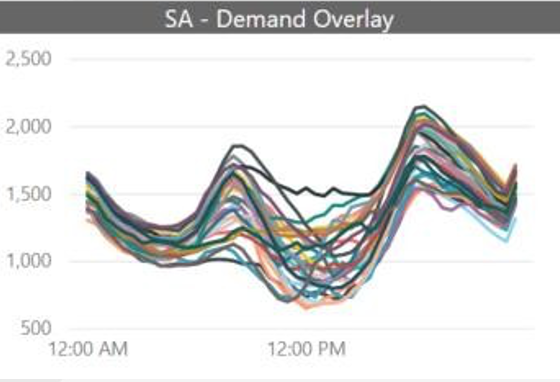
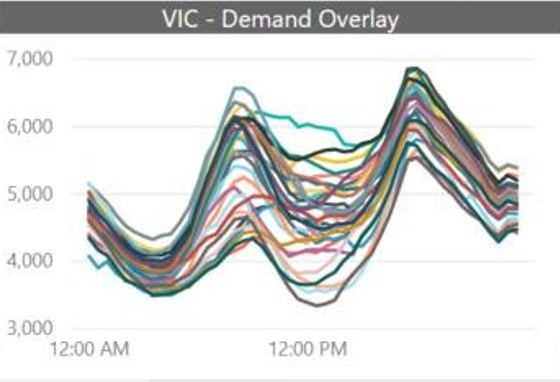
Total Energy Consumption showed little change compared to the same time last year for NSW, VIC and TAS, with all three regions seeing around just 1% less energy consumption compared to last year. QLD saw a larger drop in total energy consumption with a 5% drop, while SA saw energy consumption for May increase by 3.6% compared to the same time last year.
In terms of Maximum Demand levels for May, SA saw Maximum Demand 7% higher than the same time last year, while VIC saw Maximum Demand 7% lower. NSW, QLD and TAS meanwhile saw similar Maximum Demand to May last year.
Weather Pattern

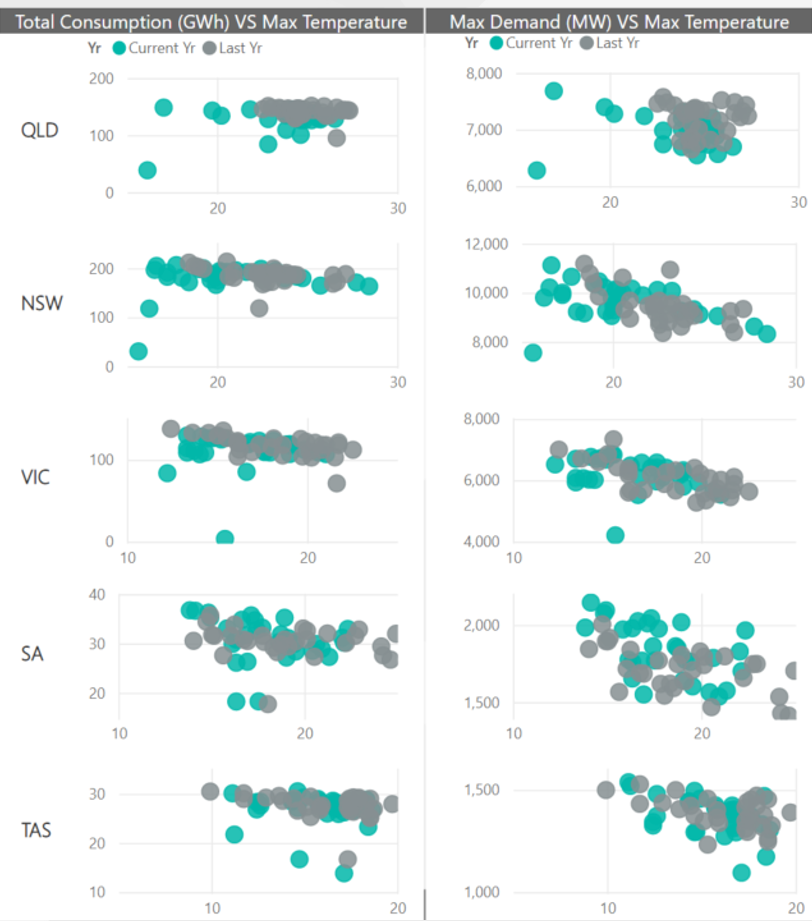
Average temperatures for May were lower for all regions compared to the same time last year. The demand weighted maximum daily temperature was a massive 3.5 degrees lower than the previous month at 15.5 degrees, and the aggregate weather exposure increased from 6.8% in April to 9.2% for May.
The plot charts to the right compare maximum daily temperatures with daily total energy consumption and maximum demand levels. NSW and QLD show a number of cold day outliers, while VIC and SA show many cooler days.
All regions experienced higher weather dependent energy during May compared to the previous month, particularly in NSW which can be observed in the chart below.
Forward Prices
Looking Forward
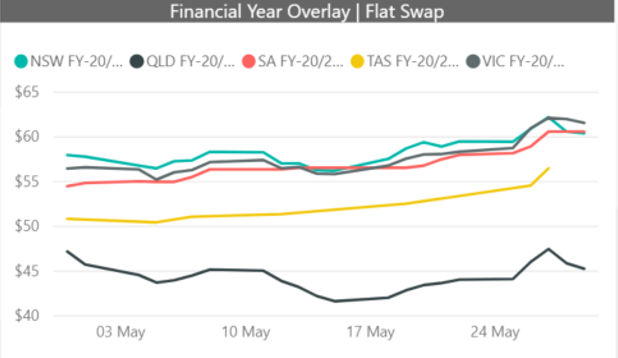
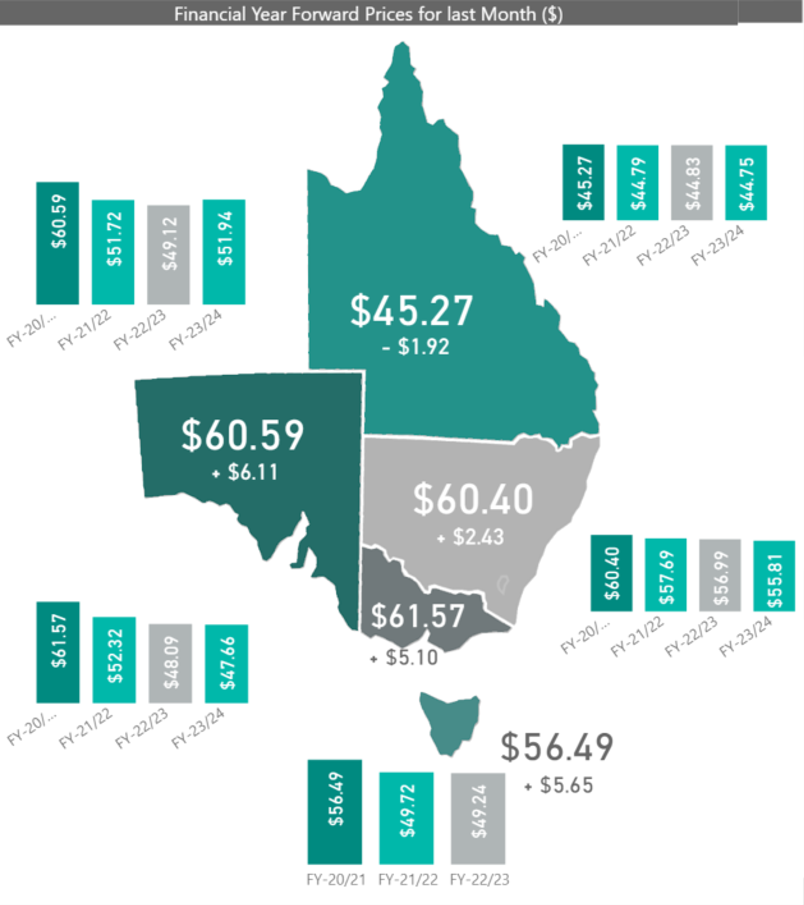
After six months of softening prices in the electricity forward market, prices rallied during May for all regions. While the southern regions began their rally in late April or early May, QLD’s FY-20/12 forward price rally started later in May resulting in a close for May of $2/MWh lower than April at $45/MWh.
SA, VIC and TAS saw FY-20/21 forward prices rise in the order of $5-6/MWh, while NSW rose by about $2.50/MWh.
