


This article reviews the summer of 2024 which was a wild ride consisting of volatile spot prices, market price expectations having a mixed performance, the consolidation of the twin peaks dynamic, and battery energy storage systems having a tough day in the office.
Summer of 2024 concluded after having the lowest January Victorian spot prices in history; followed by a wild Victorian storm crumpling transmission towers causing 500,000 customers to be load shed with maximum spot prices set for almost 2-hours. Queensland pushed through maximum demand records; and the ‘twin peaks’ phenomena is now an entrenched feature of summers. The predicted hot and dry summer did not eventuate to the same severity as predicted, although February and March were generally hotter than long term averages and drier.
1.0 Weather
We understand forecasting is tricky business, and so the Bureau of Meteorology (BoM) weather prediction issued before summer led farmers to de-stock in fear of a hot and dry summer causing lamb and beef prices to fall. AEMO issued a call for additional Demand-Side Response through the Long RET program as Victoria and South Australia system looked precarious.
However, the actual weather pattern took control of its own destiny with:
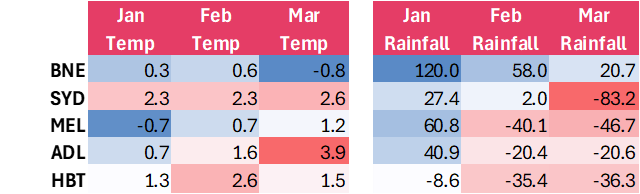
- January being slightly cooler than average in MEL, and then SYD delivered the warmest variation from the long-term average temperatures; but the month was much wetter than the long-term average across all the mainland Capital Cities
- February and March lived up to predictions of a warmer summer, but then BNE was much wetter while the southern States a lot drier. SYD also had an exceptionally dry March.
The table below shows the maximum average daily temperature deviation (degrees) from the long-term average; and then the deviation from the long-term rainfall (mm) for each Capital City.
2.0 Twin Peaks
Economic theory says that demand and supply relationships drive prices, leading to the classical outcome that the higher the demand, the higher the price. Well, in the electricity market this is not so, but instead we have twin peaks.
The maximum demand no longer necessarily aligns with the highest spot price, instead we have the maximum demand point, and then the maximum price point. The coincidence of these two maxims is no longer aligned.
The cause of these phenomena which had started a few years ago is the impact of solar generation (both roof-top and utility scale). Peak demand is occurring when the sun is above the horizon but once the sun sets, spot prices surge despite demand softening.
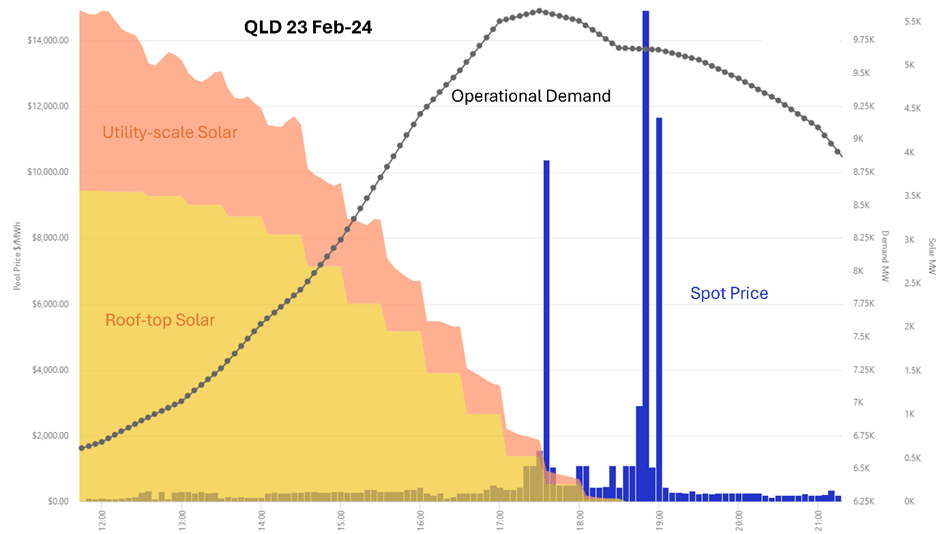
The next chart shows the solar generation, operational demand and the spot price outcomes for a sample day of 23 February in Queensland. The operational demand peaked at 5:30pm, but the prices peaked later at around 6:50pm, after the solar had set.
When we noticed how clearly this phenomenon had grown this summer, we wondered whether battery storage was the cause. The hypothesis went along the lines that battery storage was dispatched to protect the maximum demand position, and then became exhausted as demand softened; at which point the spot prices surged. But alas, the answer was simpler than that. It was and is, simply the setting sun putting solar to rest for the day.
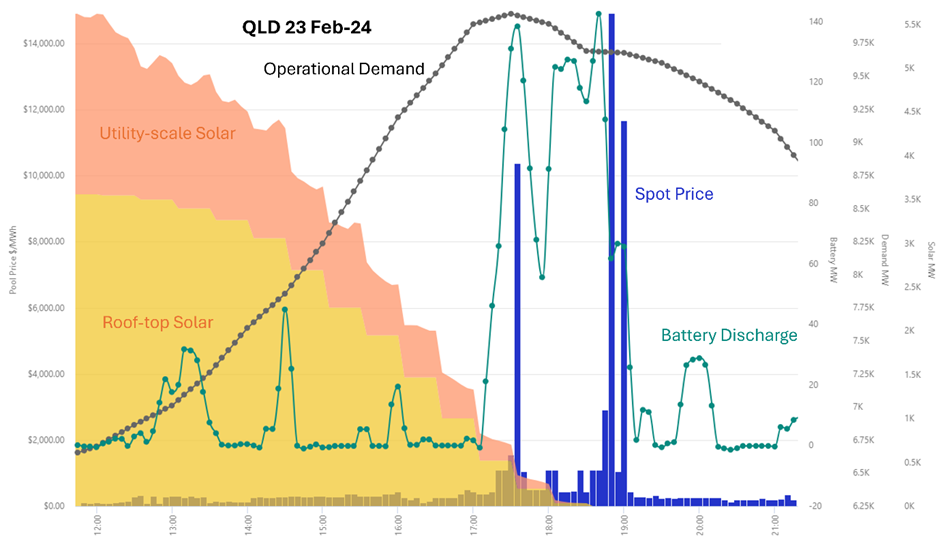
However, these types of days are a difficult day in the office for the battery sector, as demonstrated on this same sample day. The batteries were dispatched (green line on chart) when prices generally exceeded $1,000/MWh, but were only half dispatched at the critical extreme prices at 6:50pm ($14,900) and 7:00pm ($11,680). The frustration of missing the chance to maximise the revenue is compounded when it is also possible by not fully dispatching at the critical times, may have contributed to the strength of the price spikes.
Our monthly reports track and report on the actual performance of battery energy storage systems against the theoretical capture value for each month and rolling annual basis. We also track the performance of all wind and solar farms.
3.0 New Demand Records
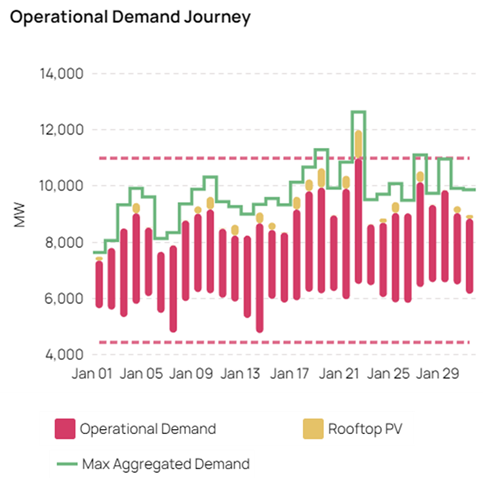
Queensland set new demand records as shown by the chart below which has the operational demand plus the roof-top solar forming the native demand. On this high-demand day, the operational demand exceeded AEMO’s forecast by about 500MW which is very material so we are sure this will cause some internal review of the forecasting algorithm. It is also a stark reminder of how much pent-up demand there exists in our system.
On 22 January, QLD’s Operational Demand was 11,005MW, and at this point of time there was another 1,000MW of Solar PV, and the maximum demand earlier in the day was 12,651MW.
We wonder if Sydney, Melbourne or Adelaide had an extreme weather day, how much pent-up demand would surface? Time will tell.
The forward QLD Q1-24 forward price pushed upward as a consequence of these hot days reaching a maximum closing price of $130/MWh for the quarter, and then finally settled at an average spot price for the month of $118/MWh.
4.0 Victorian Storm
The most notable severe weather event knocking transmission towers over was in September 2016 in South Australia when the State went ‘black’. Well, this summer it was Victoria’s turn although the storm triggered event was not as severe as South Australia’s. There were 6 transmission towers knocked down causing 2,690MW of generation to trip and 1,000MW of load to be shed.
On 13 February 2024, spot prices jumped to the price cap and remained there for just under 2-hours. Tasmania followed suit but lasted for only 1 hour and 10 minutes. None of the other Regions were materially impacted.
The chart below shows the Victorian spot prices along with the Operational Demand on 13 February 2024:
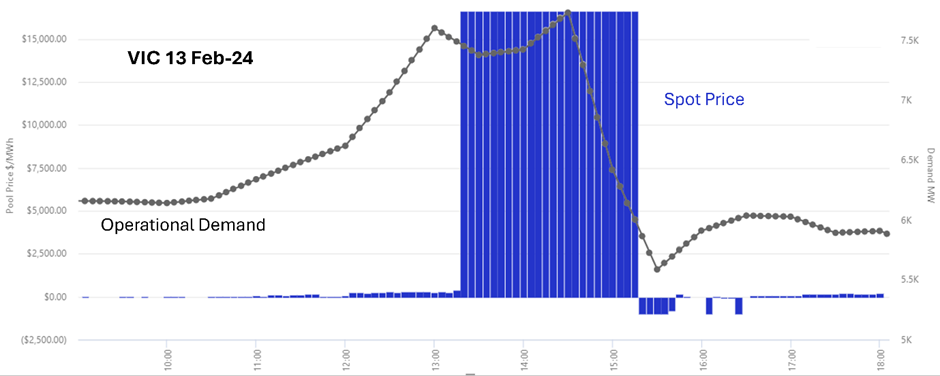
This February event followed the lowest Victorian January average spot price in history of only $22.10/MWh and caused the VIC Q1-24 forward price to jump from the doldrums of $31/MWh to surge to $83/MWh on 13 February before falling $21/MWh the next day to around $52/MWh. The quarterly average price finished at $51.67/MWh, although excluding the 13 February would have only been $36.31/MWh. However, this event did lead to soft demand in the aftermath because it took in some cases days for power to be fully restored.
5.0 Return of Callide C
Callide C's Unit 3 which has been offline since October 2022 had its return-to-service date delayed multiple times over the past year and finally returned-to-service the afternoon of 1 April. By the end of June, both units are due to be online well before Q1-25 and are expected to be available at full capacity (880MW).
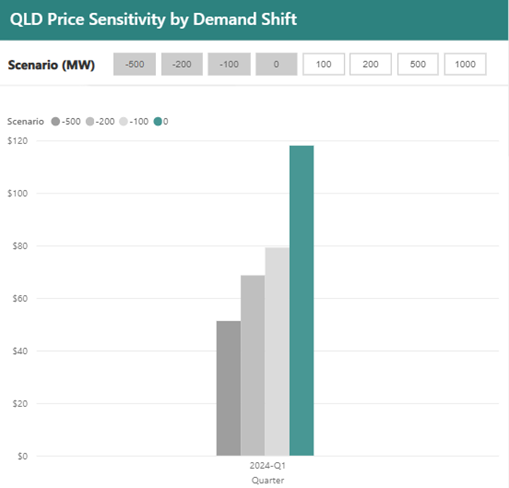
Surprisingly, the forward market for QLD Q1-25 is at similar levels of Q1-24 (circa $118/MWh) given the return of Callide C and other renewable projects coming online during this year. Undertaking a simple analysis of the Q1-24 spot prices with the published spot price sensitivities shows that a 500MW reduction in demand for all half hours (which is equivalent to an increase in supply of 500MW), would have shifted the spot price from an average of $118/MWh to $51/MWh for the quarter.
Obviously, the spot outcomes have many interactions and therefore this simple indicator is not a detailed modelling effort of the expected outcome. Nevertheless, this brief analysis does show that for some reason the forward market is not recognising the potential impact of Callide C being available for next summer.
The chart below shows the average quarterly price sensitivity for Q1-24 with a demand reduction of 100MW, 200MW and 500MW price sensitivity.
6.0 Tracking of Q1-24
Looking at the comparison between the actual quarterly spot price and the expectations of the quarter shows that:
- QLD trade weighted average for the quarter was about $128/MWh, about $10/MWh above the actual spot price ($118/MWh). The latest forward price just before the quarter started was $116/MWh, slightly under the actual spot price but very close
- NSW trade weighted average price was $131/MWh, well above the actual spot price of $87/MWh; and the final forward price before the quarter started was almost $104/MWh, also a premium to the actual result
- VIC trade weighted average price was $79/MWh before the quarter started on the back of a predicted hot and dry summer that was partially true. The events of 13 February increased the actual spot price to almost $52/MWh, well below the last forward price before the quarter started of almost $67/MWh
- SA trade weighted average price before the quarter started was almost $112/MWh which was more than twice the actual spot price of $55/MWh and also well below the last forward price of $102/MWh prior to the quarter starting
- TAS average forward price was $65/MWh which was very close to the actual spot price of $67/MWh that was impacted by the Victorian 13 February event
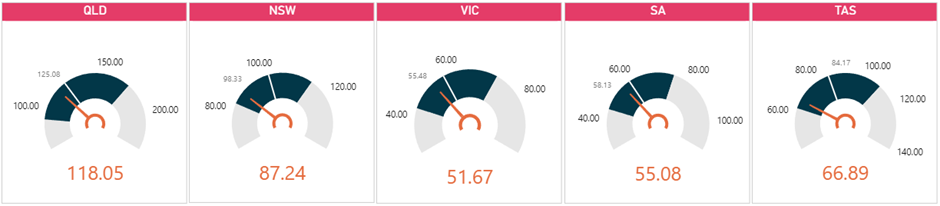
Looking back at our forecasts of Q1-24, the dials below represent our distributions between the 5th and 95th percentiles. The dark coloured segments mark our 25th to 75th percentile and the white line in the dark coloured segment represents the median of our forecast.
The results show that the actual spot prices were between our 25th percentile and median forecasts reflecting they were consistently lower than expected:
- QLD finished slightly under our median spot forecast
- NSW finished closer to our 25th percentile and given the weather in Sydney was not too testing, this was not surprising
- VIC with the hot and dry weather forecast could have been a lot stronger but with the record low January, dampened the quarterly average even though the 13 February increased the average markedly
- SA finished just under our median and also given the low number of extreme weather days, dampened the quarterly average
- TAS finished closer to our 25th percentile, and was expected to be a lot stronger than transpired
Our ability to correctly evaluate the forward price level was as follows:
- QLD traded at an average of $128/MWh which we regarded as fair given the risk. Our median spot price was slightly lower at $125/MWh which was closer to the actual spot price of $118/MWh
- NSW forward market price level was in our top quartile and was correctly deemed as most likely over-valued given the actual spot price was only $87/MWh
- VIC forward market was considered most likely over-valued at $79/MWh and the final forward price of close to $67/MWh was considered fair, sitting just below our 75th percentile. Our median forecast of $55.48/MWh was closer to the actual spot price of $51.67/MWh, but could have easily been higher
- SA forward price of $112/MWh was regarded as most likely over-valued sitting in the top 5% of our simulations. The actual price of $55.08/MWh was below our 25th percentile, and therefore could have been easily much higher with an expected case of $84/MWh, but our view that the SA forward price was most likely over-valued was correct
- TAS forward price was remarkedly close to the average spot price and we expected the spot price could have been easily much stronger. The actual spot price finished just above our 25th percentile.
7.0 Conclusion
As with all summer quarters, there was a story to tell. Summer of 2024 contained a mixed range of outcomes including record low spot prices, spot prices sitting at the cap for nearly 2-hours, record demand levels set, and there is an open question of pent-up demand levels driven by the installation of varying types of cooling systems becoming standard practice in our homes.
Our focus now moves onto the winter quarters, with just as many challenges to predict and understand the dynamics.
Disclaimer and Notes
Energybyte is published by Empower Analytics Pty Ltd (ABN 38630239002), Authorised Representative no 1274453 of Capital Treasury Solutions (AFSL 429066). Any questions or feedback must be directed to Empower Analytics Pty Ltd as the sole publisher.
This newsletter contains general information and is not advice to buy or sell any position.
Empower Analytics has exercised professional care in the preparation of this newsletter, the information includes data from third parties which is not independently verified and it is current at the date of publication. Empower Analytics is under no obligation to update this data.
Before making any trading or investment decision, you should seek professional advice. No liability is accepted for actions or omissions by anyone. Past performance do not predict future outcomes.